Download
1 / 59
590 likes | 850 Views
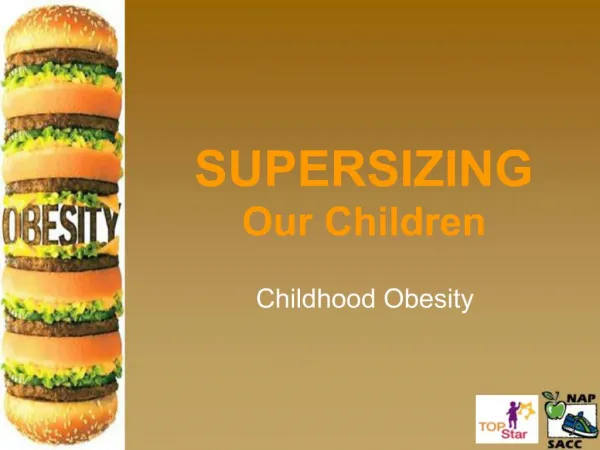
SUPERSIZING Our Children The Childhood Obesity Epidemic. INSERT YOUR NAME AND INFO HERE. Objectives. Describe prevalence and contributing factors of overweight and obesity in infants and children. List possible consequences of being overweight as a young child.

E N D
SUPERSIZINGOur ChildrenTheChildhood Obesity Epidemic INSERT YOUR NAME AND INFO HERE
Objectives • Describe prevalence and contributing factors of overweight and obesity in infants and children. • List possible consequences of being overweight as a young child. • Describe the role of the child care environment and of child care staff in helping to prevent overweight in children. • List ways in which the child care facility can help children eat healthier and get more activity.
Obesity is Caused by Long-Term Energy Imbalance FatStores Energy Expenditure Energy Intake
Obesity Trends* Among U.S. AdultsBRFSS1990, 2000, 2010 (*BMI 30, or about 30 lbs. overweight for 5’4” person) 2000 1990 2010 No Data <10% 10%–14% 15%–19% 20%–24% 25%–29% ≥30%
Based upon BMI measurements: • 69% of the US adult population is overweight • More than one third of adults (35.7%) are considered obese SOURCE: http://www.cdc.gov/obesity/data/adult.html
Obesity Trends for Maine (1990-2012) Source: America’s Health Rankings Report, The United Health Foundation, http://www.americashealthrankings.org/ME/Obesity
Only about 14% of U.S. adults eat the recommended servings of fruits and vegetables each day. • More than 60% of American adults do not get the recommended amount of physical activity to provide health benefits. • Nationally, 25% of all adults are not active at all. SOURCES: Cawley J, Meyerhoefer C. The medical care costs of obesity: an instrumental variables approach. J Health Econ. 2012; 31:219-30. AND Wang CY, McPherson K, Marsh T, Gortmaker S, Brown M. Health and economic burden of the projected obesity trends in the USA and the UK. Lancet. 2011; 378:815-25.
The Estimated Cost… • Adults: • Obesity accounted for 21% of medical spending – or $190 Billion – in 2005 • It’s estimated by 2030 obesity-related medical costs could go up by $48 to $66 billion a year in the U.S. • Children: • 1979 to 1999 saw a tripling of annual costs, rising from $35 million to $127 million. • The annual cost nearly doubled from 2001 to 2005 due to hospitalizations relating to obesity (from $125.9 million to $237.6 million. SOURCES: Cawley J, Meyerhoefer C. The medical care costs of obesity: an instrumental variables approach. J Health Econ. 2012; 31:219-30. AND Wang CY, McPherson K, Marsh T, Gortmaker S, Brown M. Health and economic burden of the projected obesity trends in the USA and the UK. Lancet. 2011; 378:815-25.
What Factors Affect Obesity? • Biology ~Genes • Behaviors ~Diet ~Physical activity • Environments ~Social ~Physical Focus on what we can change!
Why the Increase In Obesity? • Rising obesity rates result from increases in caloric intake and/or decreases in caloric expenditure • The rise in obesity rates in the last decade could be explained by as little as an average net increase of 100 calories per day. SOURCE: www.healthyheart.org/nutrition/caloricostofexercise.htm
Changes in Caloric Intake from 1970 to 2000 • Adults • Men: 2,450 to 2,618 kcal/day (+7% ) • Women: 1,542 to 1,877 kcal/day (+22% ) • Children • Boys: 2,550 to 2,800 kcal/day (+10%) • Girls: 1,780 to 1,900 kcal/day (+7%) In the past decade intakes have remained fairly stable.
Help, the Environment is Making US Fat!
Brainstorm Ideas? What factors in the environment make it hard for us to eat smart and move more?
Are children from rural areas, like much of Maine, more or less active? • Higher percentages of rural children have been identified as obese compared to urban children. • It may be harder for rural children to participate in after-school activities such as sports; transportation may be one of the reasons why • Rural children may spend MORE time being inactive as well Source: Center for Rural Affairs 2009
Eating Away from Home Contributes to Portion Distortion FRENCH FRIES Today 30 Years Ago 210 Calories 2.4 ounces 610 Calories 6.9 ounces Calorie Difference: 400 Calories
Presence of Convenience Stores and Absence of Grocery Stores
School and Work • Poor food choices in cafeteria or vending machines • Minimal PA opportunities, even in schools • School or work environments that don’t support or encourage healthy eating or PA • Time limitations • Difficult to bring food from home • Technology that makes work easier, but reduces PA
Home – Food Environment • Availability and accessibility of fruits & veggies and healthy snacks • Family meals, especially for children • Family traditions (walks after dinner; playing with the kids) Adults control what enters the home!
Home – Media Use • Media importance in home (use of TV at meals, video games, etc) • Number and location of TVs • Particularly access to media in the bedroom • TV watching: • Decreased movement • Increased calories and cravings
Home – Outdoor Play Time • Free play outdoors is important • Increased fitness levels • Decreased stress • Stronger immune systems • Better test scores • More creativity • Happier demeanor
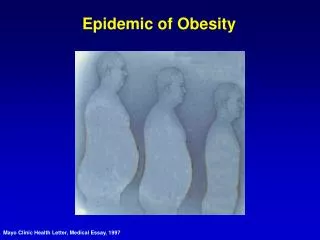
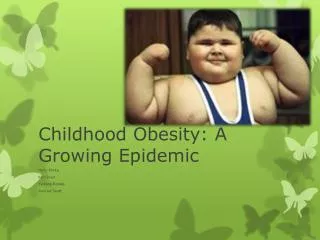
Overweight and Children Childhood Obesity
Weight categories for children are determined by growth charts Obese Overweight
Overweight Infants? • In 2003-2004, NHANES estimated 9.5% percent of infants and children less than 2 years of age were obese. SOURCE: The 2003-2004 National Health and Nutrition Examination Survey (NHANES),
Should We Be Concerned? • Overweight is now the most common nutritional disease of children. • Preschool children who are overweight are almost 5x more likely to be overweight as young adults • Carrying extra body weight is a risk factor for many chronic conditions and health problems.
Brainstorm Ideas? What are the health risks to overweight or obese children?
Health Risks of Obesity • Heart Disease Total cholesterol Serum triglycerides Blood pressure • Breathing Problems • Type 2 Diabetes • Musculoskeletal Problems • Fatty Liver • Weight Discrimination
Contributors to Child Obesity • Food choices • Physical activity • Eating patterns
Contributors to Childhood Obesity • Obese parents • Parenting style • Parents with poor health behaviors
Contributors to Childhood Obesity • Diabetes during pregnancy • Low-birth weight • Excessive weight gain in pregnancy • Formula feeding • Demographic Factors
The Child Care Environment • Nearly 28% of children (infants to age 5 years) are in some kind of organized child care. • 55% of 3-6 year olds are in early care and education programs. • Child care setting is an ideal setting for promoting early development of healthy behaviors
What Can We Do? • Focus on what we can change! • Nutrition • Physical activity • Feeding interactions • Role Modeling!
Brainstorm Ideas? • What can YOU do to help prevent obesity in preschoolers?
Implement the Strategies for Success Provide healthy choices for snacks and celebrations; limit unhealthy choices.
Implement the Strategies for Success Provide water and low fat milk; limit or eliminate sugary beverages.
Implement the Strategies for Success Provide non-food rewards.
Implement the Strategies for Success Provide opportunities for children to get physical activity every day.
Implement the Strategies for Success Limit recreational screen time. *Keep TV/Computer out of the bedroom. No screen time under the age of 2.
Implement the Strategies for Success Participate in local, state, and national initiatives that promote healthy eating and active living.