Download
1 / 18
180 likes | 337 Views
Stem-and-Leaf Displays. Section 2.3 Statistics Mr. Keltner. Exploratory Data Analysis. “E.D.A.” Particularly useful for detecting patterns and extreme data values Designed to: Help us explore a data set. Ask questions we had not thought of before

E N D
Stem-and-Leaf Displays Section 2.3 Statistics Mr. Keltner
Exploratory Data Analysis • “E.D.A.” • Particularly useful for detecting patterns and extreme data values • Designed to: • Help us explore a data set. • Ask questions we had not thought of before • telling whether our data is scattered and random • if our values are centered around a certain range of values • Pursue leads in many different directions
Key ingredient of an E.D.A. • Rapid implementations • It’s quick to put one together • Allows us to create visual displays such as graphs and charts • Data simplification and organization • Robustness • Analysis that is not influenced by extreme data values
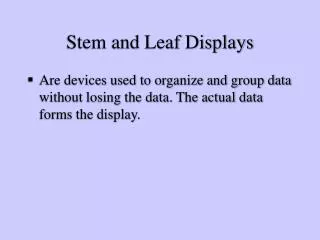
Stem-and-Leaf Displays • Device that organizes and groups data, but allows us to recover the original data if desired • The only display we have used so far that allows us to recover our original data set • Histogram, Bar Graph, Circle Graph, and Time-Series Graphs all are unable to recover the original data set
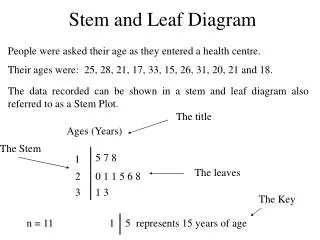
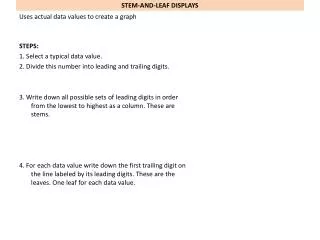
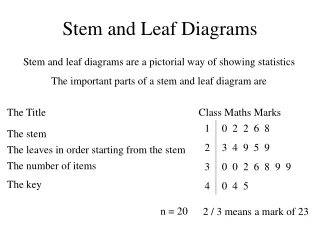
To make a stem-and-leaf display • Break the data into TWO groups • Stems are usually the most significant values (most amount of place values: hundreds, tens, units, etc.) in the data set, but selecting them depends on the tendencies of the data set • Leaves are usually the parts of the values that make the values distinguishable • We are free to choose the number of digits included in the stems • Indicate a scale. Simply indicate how one stem value and one leaf value represents an original data value in the label on the display at the top.
Example 1: The weights of carry-on luggage was recorded in pounds with the following values. Construct a stem-and-leaf display from the data.
Example 2 • The heights of the Eudora 2006-2007 boys’ basketball team are listed below. 69 70 67 69 73 67 67 70 75 76 68 74 70 68 73 70 72 71 70 73 73 67 65 65 73 62 67 68 66 68 74 Construct a stem-and-leaf display for the data set. 2007-2008 Data
Solution: Heights of Players • Since there is so little difference in most of our data values, it may be necessary to make more than one stem for a group of numbers. • We can separate all the values in the 60’s and 70’s into two separate groups. • We will call our new leaves 6’and 6* for the 60’s and 7’ and 7* for the 70’s. • Let 6’ and 7’ represent the units digits 0-4. • Let 6* and 7* represent the units digits 5-9.
Shape of Distribution • We can also use a stem-and-leaf display to determine the shape of our data distribution. • Would you say that our player height data would be: • Uniform/rectangular? • Symmetrical? • Skewed left? • Skewed right? • Bimodal?
Extension: Player Heights • Which shape(s)? • Uniform/rectangular? • Symmetrical? • Skewed left? • Skewed right? • Bimodal? Assessment
Example 2: ‘07-’08 team • The heights of the Eudora 2007-2008 boys’ basketball team are listed below. 70 68 68 71 66 69 73 70 68 65 69 72 75 70 77 73 70 73 73 65 74 73 69 68 62 68 66 64 68 68 68 71 72 71 70 69 71 Construct a stem-and-leaf display for the data set.
Solution: Heights of Players • Since there is so little difference in most of our data values, it may be necessary to make more than one stem for a group of numbers. • We can separate all the values in the 60’s and 70’s into two separate groups. • We will call our new leaves 6’and 6* for the 60’s and 7’ and 7* for the 70’s. • Let 6’ and 7’ represent the units digits 0-4. • Let 6* and 7* represent the units digits 5-9.
Shape of Distribution • We can also use a stem-and-leaf display to determine the shape of our data distribution. • Would you say that our player height data would be: • Uniform/rectangular? • Symmetrical? • Skewed left? • Skewed right? • Bimodal?
Extension: Player Heights • Which shape(s)? • Uniform/rectangular? • Symmetrical? • Skewed left? • Skewed right? • Bimodal?
Assessment Pgs. 61-63: #’s 1-6