Download
1 / 46
470 likes | 588 Views
This presentation discusses key extensions to the EVAS agent-based pedestrian modelling framework integrated into Depthmap v10. We explore enhancements that allow users to set origins and destinations for individual pedestrian journeys and export detailed journey data as vector traces. The paper outlines the original framework's structure and introduces significant refinements, emphasizing the incorporation of land use distribution as a matrix of trip origin-destination information. This approach meets practical master planning requirements, aiding the design of pedestrian environments.

E N D
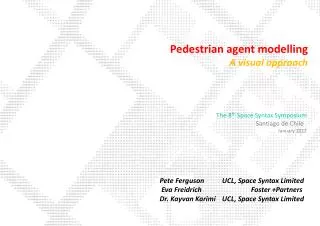
Pedestrian agent modelling A visual approach The 8th Space Syntax Symposium Santiago de Chile January 2012 Pete Ferguson UCL, Space Syntax Limited Eva Freidrich Foster +Partners Dr. Kayvan Karimi UCL, Space Syntax Limited
Presentation outline Here we present some key extensions to the EVAS agent based pedestrian modelling framework for Depthmap v10 used within the Space Syntax Ltd office. The tools include the ability to set origin and destinations to each pedestrians' journey and to export individual journey information in the form of a vector trace of the journey path. In this paper we first discuss the structure of the original EVAS agent modelling framework and describe various additions and refinements that have been proposed for the program. We then go on to show how another important component of an agent's environment - the distribution of land use activities - can be incorporated as a matrix of trip origin-destination information. We go on to show why such an approach is needed in the practical requirements of masterplanning pedestrian environments and show how the tool can potentially be applied in the design process.
Introduction to Agent Based Modelling (ABM) In Agent Based Modelling (ABM) the city is viewed as an emergent phenomenon arising from the microscopic encounters of its individual citizens with resulting descriptions having moved from top-down to bottom-up (Turner, Mottram and Penn 2005). Agent based models relate to this paradigm in that they afford agency to the individual actor and attempt to understand aggregate implications of micro-level behaviour. They provide information on the individual’s experience and how that contributes to collective phenomena rather than providing a description of the system as an abstract object in its own right. Agents are imbued with general behavioural traits but their specific actions are not pre-determined. This implies a degree of freedom in decision making which is most frequently operationalised through a form of random actionconstrained by the pre-defined behavioural framework. It is this randomness or variability that not only distinguishes one agent from another as a unique individual but enables such agents to engage in exploration of their environment.
Introduction to ABM There are various methods for incorporating the physical environment into an agent model. Often the environment is represented as pre-defined paths through space rather than a two or three dimensional field of opportunity. The routing of agents along these paths is also often pre-determined, based on calibration from observed data or on sophisticated but deterministic route-choice mechanisms. This approach may be suitable for models where there is little scope for independent exploration but at a pedestrian level where movement is unregulated and contain no specific goal, this is limiting. (Turner and Penn 2002).
Origin- destination agents Mega Ellhniko, Athens Pedestrian path
Introduction to ABM Another way of incorporating an environment is by engraining its physical bounds with a repulsive force, enabling the environment to influence agent behaviour in a way that complements the social forces inherent in many agent to agent interactions. Many micro simulation agent models such as the seminal social force approach by Helbing and Molnar (1994) contain such active forces and in so doing view the environment in analogy to a physical force that must be adapted to and overcome.
Introduction to ABM The EVAS agent modelling framework used by the space syntax community, views the environment in a slightly different way again. Following the theory of affordances (after Gibson 1979) agents are programmed to view space as a resource to be explored rather than a constraining factor and individuals seek available spacerather than avoid occupied space (Penn and Turner 2002).
EVAS agent modelling The basic EVAS agent modelling framework operates on a simple concept of affordance whereby the natural reaction of an individual in response to the availability of space is to walk toward it. Reproducing this simple exploratory behaviour requires agents to recognise the relative availability of space through a virtual form of vision. Agents are guided by an exosomatic visual architecture (EVA) that is constructed prior to model processing in the form of a dense-grid visibility graph. The visibility graph is computed by overlaying a two-dimensional grid (at some arbitrary resolution) over a layout in plan view, and calculating which points within the grid are able to see which other points. The resulting visibility graph can be used to calculate the approximate viewable area, or isovist, from each point on the grid and the set of visible locations for each point are stored in a lookup table (Turner and Penn 2002).
170° EVAS agent modelling In the case of both the original EVAS framework and the extended OD agent model presented here, the standard field of view is a subset of 170° from the original 360° isovist as this corresponds to the approximate occlusion of human vision. When used in an agent model, the set of visible locations from any given point is subdivided into angular segments and the agent is assigned a heading and field of view in relation to the segments that are visible from its current location.
EVAS agent modelling Longer site lines will contain a larger number of visible spaces so the random draw of a destination means that an agent is probabilistically more likely to choose its next step in line with the visual continuity of space. Once the field of vision has been defined, an agent simply chooses a destination that lies within the field at random, walks toward it for a set number of grid space and then repeats the decision making process. The emergent patterns of space use formed by multiple agents correlate well with pedestrian movement in the Tate Britain Gallery, with a coefficient of up to R²=0.76 (Turner and Penn 2002).
Origin- destination agents Turner, Mottram and Penn (2005) observed that agent behaviour following the pure affordance mechanism lead to a concentration of movement in larger public spaces, simply driving them to congregate in open areas if the program is left to run to a steady state. To overcome the adherence to open space over time, they applied the simplest form of origin-destination matrix where each agent would start at a random location in open space, have a random destination in open space and movement toward the destination employed a visual field that was always directed to the destination rather than the current heading. When applied to Barnsbury, the origin-destination agents, generated a better correlation with observed pedestrian movement. We conjecture that a better representation of possible origin and destinations in the environment would further improve correlation.
Origin- destination agents In this paper, we present a simple augmentation of the core EVAS agent modelling framework, which enables bespoke trip origin-destination information to be assigned to individual agents and incorporates both locational and visual cues in the agent decision making process. In this sense it is an incremental extension of work already undertaken by Turner, Mottram and Penn though its implementation here enables a number of useful applications in everyday design contexts. Underlying the visual component of the model is the same dense-grid visibility graph that supports the original EVAS implementation. In addition however, location is introduced in the form of a second look up table of origin and destination information where the inputs and outputs into the system are proportional to the category and intensity of activity at opposing ends of a journey.
Origin- destination agents To set up the OD agent model, available data on the number and location of individual journey origins and destinations is required. If detailed information on absolute numbers is not available, the OD matrix can be used as a weighting system where the number of entries or exits at a given location is proportional to the 'attraction' of a plot defined by another parameter. Rather than applying a single weighting to each location both an origin and destination value can be assigned, enabling more specific journey scenarios to be constructed. The images below show trip origin and destination data applied to a simple pedestrian environment. Each location receives a value as an origin and a destination relative in this case to the number of building occupants expected on completion of the project.
Origin- destination agents Next, a second look-up table is constructed, complementing the visual graph and included to provide each agent with information on its position relative to its eventual destination. The topological and geometric distance from a destination to every grid space is required so that an agent can understand its location at any point on the grid. This pre-calculation process only has to be completed once even if individual origin- destination weights change.
Origin- destination agents • The agent runs through the following calculation at each time step: • Calculate my visual field from my current heading (e.g 170° from the original 360° isovist) • 2. Take a subset of space from the visual field that lies as close as or closer than my current position to my eventual destination. • 3 If there are no available spaces that meet the criteria of the subset, choose a space from the full 360° isovist • 4. Choose a space at random from this final subset (from step 2 or 3) • 5. Walk toward the chosen location for a set number of grid spaces and repeat
Origin- destination agents The result of a few agents progressing from a single origin to a couple of destinations in a simple urban environment Agent path
Origin- destination agents Multiple origins to a single destination showing the emergence of recognisable patterns from their collective behaviour Agent path
Origin- destination agents Pedestrian navigation is still influenced by exploratory behaviour. As such the resulting pattern of movement is unique - even when the origin-destination pairs are symmetrically reversed. Morning Path overlap high low
Origin- destination agents Note that the pattern of flow in the evening commute is not the reverse of the morning commute. Evening Path overlap high low
Application The EVAS extension is being used on various consultancy projects undertaken by Space Syntax Ltd offices. Much of the tool was developed to offer design support to Foster and Partners during the masterplanning of the Masdar City development in Abu Dhabi. A range of further developments are underway that build in more functionality for a wider range of application. Here are a few examples of how the tool has been put to use…
Application Masdar Eco City in Abu Dhabi is being developed as an independent settlement of 60,000 inhabitants adjacent to Abu Dhabi international Airport. The vision is for the city to be carbon neutral and as such encouraging sustainable modes of transportation, in particular pedestrian movement, is an important aspect of the masterplanning process.
Application Existing
Application Vision
Application Our initial input was concerned with understanding the likely volume and distribution of pedestrian movement across the whole development. For this we developed further model extensions to incorporate origin-destination factors into angular segment models… but that’s another story! The intention was to gauge the likely success of the proposed pedestrian promenade under a range of development scenarios…
Application Pedestrian forecast (No PRT usage) Airport Kalifa City Movement high low
Application Pedestrian forecast (Intermediate PRT usage) Airport Kalifa City Movement high low
Pedestrian forecast (Heavy PRT usage) Application Airport Kalifa City Movement high low
Application • The origin destination agent model was used in Masdar to enable us to understand: • where people would be likely to concentrate • which places would be busier or quieter • which routes would be used and which wouldn’t • and track changes in distribution as different phases of the development are completed. • Again origin-destination information was provided on proposed land use categories and intensity. Agent path
Application The resulting pattern of pedestrian movement within each phase could be used to align the land use components of the masterplan. E.G Retail shown in grey adjacent to high movement flows. Retail Footfall High Low
Application Building outline Shading More and more layers of influence could then be included, tested and optimised, in this case, the impact of shading structures on individual route choice.
Application Building outline Shading …this can be seen to change over time as activity patterns and the location of shaded pedestrian realm shifts throughout the day. Footfall High Low
Application Building outline Shading …this can be seen to change over time as activity patterns and the location of shaded pedestrian realm shifts throughout the day. Footfall High Low
Application Building outline Shading …this can be seen to change over time as activity patterns and the location of shaded pedestrian realm shifts throughout the day. Footfall High Low
Application Building outline Shading …this can be seen to change over time as activity patterns and the location of shaded pedestrian realm shifts throughout the day. Footfall High Low
Application Building outline Shading …this can be seen to change over time as activity patterns and the location of shaded pedestrian realm shifts throughout the day. Footfall High Low
Application Movement volumes for individual streets could be derived from the origin-destination data provided. 150 People Per Hour 700 People Per Hour Footfall 450 People Per Hour High Low Executive summary Key findings What will Phase 1 look like?
Application The paths of specific journeys could be selected and assessed. In this case, the journey to the Mosque at mid-day Landscaping Building outline Agent path
Application This can then be further disaggregated to look at the journeys of specific groups of pedestrians Students Shoppers Landscaping Building outline Office workers
Application The tool can be used quite effectively in internal environments. Here, the movement of office workers in the lobby of an office tower is being assessed showing higher concentrations of flow at the entrance to lift banks. Agent Movement High Low
Application Again individual groups of pedestrians can be identified and points of potential capacity constraint and journey conflict identified. Points of conflict Entering Classroom Leaving Classroom
Application From this Level of Service can be derived Level of Service
Application The tool has also been used on UK masterplanning projects as a means of rapidly testing the implications of design options Footfall High Low
Application The tool has also been used on UK masterplanning projects as a means of rapidly testing the implications of design options Footfall High Low
Application The tool has also been used on UK masterplanning projects as a means of rapidly testing the implications of design options Footfall High Low
Conclusion Here we have presented a simple extension of the EVAS agent modelling framework that combined the exploratory nature of most pedestrian movement with the purposive nature of specific origin-destination journeys. The tool has enabled Space Syntax Ltd to offer more traditional agent modelling design advice such as levels of service, conflict analysis and land use planning. The tool is still in its infancy and many further developments are required to provide a full range of ABM services. More extensive validation is also required and comparisons made with the original EVAS modelling and alternative approaches to footfall prediction.
Thank You! The 8th Space Syntax Symposium Santiago de Chile January 2012 Pete Ferguson UCL, Space Syntax Limited Eva Freidrich Foster +Partners Dr. Kayvan Karimi UCL, Space Syntax Limited