Download
1 / 1
10 likes | 28 Views
Business Name - Hal Waldman & Associates<br><br>Website - https://waldmaninc.com/<br><br>Business Address - 1326 Freeport Rd #100, Pittsburgh, PA 15238<br><br>Phone - (412) 338-1000<br><br>Facebook URL - https://www.facebook.com/WaldmanInc/<br><br>Twitter URL - https://twitter.com/halwaldman<br><br>Linkedin URL - https://www.linkedin.com/company/hal-waldman-&-associates/<br><br>Youtube URL - https://www.youtube.com/user/AttorneyHalWaldman<br><br>Link - https://waldmaninc.com/6-surprising-motorcycle-accident-stats-from-pennsylvania/

E N D
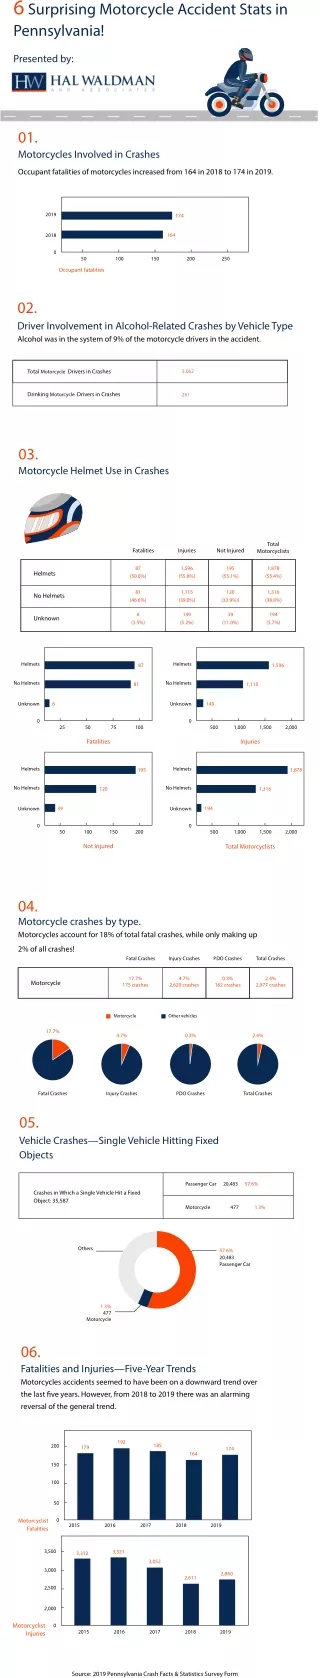
6Surprising Motorcycle Accident Stats in Pennsylvania! Presented by: 01. Motorcycles Involved in Crashes Occupant fatalities of motorcycles increased from 164 in 2018 to 174 in 2019. 2019 174 164 2018 0 50 100 150 200 250 Occupant fatalities 02. Driver Involvement in Alcohol-Related Crashes by Vehicle Type Alcohol was in the system of 9% of the motorcycle drivers in the accident. Total Motorcycle Drivers in Crashes 3,062 Drinking Motorcycle Drivers in Crashes 261 03. Motorcycle Helmet Use in Crashes Total Fatalities Injuries Not Injured Motorcyclists 87 1,596 (55.8%) 195 1,878 (55.4%) Helmets (50.0%) (55.1%) 81 1,115 (39.0%) 120 1,316 (38.8%) No Helmets (46.6%) (33.9%)) 6 149 (5.2%) 39 194 (5.7%) Unknown (3.5%) (11.0%) Helmets Helmets 87 1,596 No Helmets No Helmets 81 1,115 6 149 Unknown Unknown 0 0 25 50 75 100 500 1,000 1,500 2,000 Fatalities Injuries Helmets Helmets 195 1,878 No Helmets No Helmets 120 1,316 39 194 Unknown Unknown 0 0 50 100 150 200 500 1,000 1,500 2,000 Not Injured Total Motorcyclists 04. Motorcycle crashes by type. Motorcycles account for 18% of total fatal crashes, while only making up 2% of all crashes! Fatal Crashes Injury Crashes PDO Crashes Total Crashes 17.7% 175 crashes 4.7% 0.3% 2.4% Motorcycle 2,620 crashes 182 crashes 2,977 crashes Motorcycle Other vehicles 17.7% 4.7% 0.3% 2.4% Fatal Crashes Injury Crashes PDO Crashes Total Crashes 05. Vehicle Crashes—Single Vehicle Hitting Fixed Objects Passenger Car 20,483 57.6% Crashes in Which a Single Vehicle Hit a Fixed Object: 35,587 Motorcycle 477 1.3% Others 57.6% 20,483 Passenger Car 1.3% 477 Motorcycle 06. Fatalities and Injuries—Five-Year Trends Motorcycles accidents seemed to have been on a downward trend over the last fve years. However, from 2018 to 2019 there was an alarming reversal of the general trend. 192 185 200 179 174 164 150 100 50 0 Motorcyclist Fatalities 2015 2016 2017 2018 2019 3,500 3,321 3,312 3,052 3,000 2,860 2,611 2,500 2,000 Motorcyclist Injuries 0 2015 2016 2017 2018 2019 Source: 2019 Pennsylvania Crash Facts & Statistics Survey Form