Download

1 / 20
200 likes | 215 Views
This lesson explores linear regression and the method of least squares to find the relationship between two populations and predict values. Engineers often use regression analysis to fit curves to experimental data.

E N D
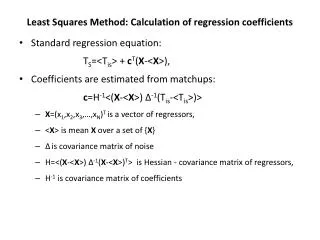
LESSON 21: REGRESSION ANALYSIS Outline • Linear Regression • The Method of Least Squares
Linear Regression • This lesson addresses the problem of finding a relationship between two population. The goal is to predict values for one population on the basis of observations taken from the other. • Engineers often encounter such problems whenever they need to fit a curve to experimental data. Recall that a scatter diagram is a graph that plots points representing relationship between two variables, an independent variable and a dependent variable . A curve can be fitted to the scatter plot using a regression analysis. • A linear regression assumes a linear relationship and fits a straight line. The method of least square is a method that finds the particular line.
Y Dependent variable X Independent variable Linear Regression The scatter diagram on this slide shows a linear relationship between two variables.
Regression equation: Y = a + bX Y Dependent variable X Independent variable Linear Regression A straight line of the form Y = a+bX nicely fits the points. Linear regression provides values of parameters a and b
Deviation, or error Regression equation: Y = a + bX Y Estimate of Y from regression equation { Actual value of Y Dependent variable Value of X used to estimate Y X Independent variable The Method of Least Squares The least square method finds a and b such that the sum of the squares of errors is minimum
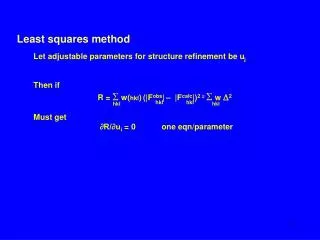
The Method of Least Squares • Consider n observations • For the ith observation Xi, the predicted value • The least square method finds a and b to minimize the sum of the squares of deviations of the predicted values from the actual values
The Method of Least Squares • The following a and b minimize the sum of the squares of deviations
Linear Regression • The standard deviation of the individual Y observations: • The standard error of the Y estimate • Note: The divisor is n minus the number of regression coefficients.
Sales Advertising Month (000 units) (000 $) 1 264 2.5 2 116 1.3 3 165 1.4 4 101 1.0 5 209 2.0 Linear Regression Using Least Squares Future sales are unknown, but future advertising expenses are given by marketing plan. A known value of advertising expense is used to forecast sales. For such a forecast, we need the relationship between advertising and sales. Since sales depends on advertising, sales is the dependent variable and shown on the Y-axis. Advertising is the independent variable and shown on the X-axis.
Sales, Y Advertising, X Month (000 units) (000 $) XYX 2 1 264 2.5 2 116 1.3 3 165 1.4 4 101 1.0 5 209 2.0 Total Y= X = XY - nXY X 2 - nX 2 a = Y - bX b = Linear Regression Using Least Squares
Sales, Y Advertising, X Month (000 units) (000 $) XYX 2 1 264 2.5 660.0 6.25 2 116 1.3 150.8 1.69 3 165 1.4 231.0 1.96 4 101 1.0 101.0 1.00 5 209 2.0 418.0 4.00 Total 855 8.2 1560.8 14.90 Y= 171 X = 1.64 XY - nXY X 2 - nX 2 a = Y - bX b = Linear Regression Using Least Squares
Sales, Y Advertising, X Month (000 units) (000 $) XYX 2 1 264 2.5 660.0 6.25 2 116 1.3 150.8 1.69 3 165 1.4 231.0 1.96 4 101 1.0 101.0 1.00 5 209 2.0 418.0 4.00 Total 855 8.2 1560.8 14.90 Y = 171 X = 1.64 a = - 8.136 b = 109.229 Linear Regression Using Least Squares
300 — 250 — 200 — 150 — 100 — 50 Linear Regression Using Least Squares Y = - 8.136 +109.229(X) Interpretation: For each $1000 increase in advertising, sales increases by 109,229 units. Sales (000s) | | | | 1.0 1.5 2.0 2.5
Linear Regression Using Least Squares The regression equation can be used to forecast sales of Month 6 from a known value of advertising expenditure in Month 6. Forecast for Month 6: Let advertising expenditure = $1750 Y =
Linear Regression Using Least Squares Forecast for Month 6: Let advertising expenditure = $1750 Y =-8.136+109.229(1.75) = 183.015 thousand units
Example Example 1: The following sample observations have been obtained by a chemical engineer investigating the relationship between weight of final product Y (in pounds) and volume of raw materials X in gallons. Find a and b: X Y 14 68 23 105 9 40 17 79 10 51
Example X Y XY X2 14 68 23 105 9 40 17 79 10 51
Example Example 2: Consider Example 1. Compute the sample standard deviation for final product weight.
Example Example 3: Consider Example 1. Compute the standard error of estimate for final product weight.
READING AND EXERCISES Lesson 21 Reading: Section 4-1 pp. 90-102 Exercises: 4-1, 4-2