Download
1 / 40
400 likes | 432 Views
Explore GIS-based tools, air quality and noise mapping software, and cutting-edge modeling systems for Environmental Impact Assessment (EIA). Learn about regional air quality models and their application in pollution control strategies.

E N D
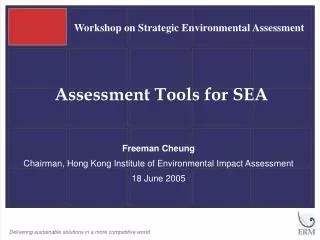
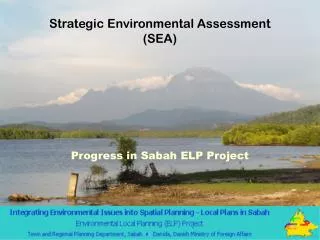
Workshop on Strategic Environmental Assessment Assessment Tools for SEA Freeman Cheung Chairman, Hong Kong Institute of Environmental Impact Assessment 18 June 2005
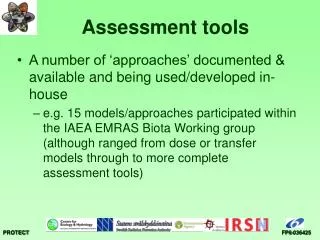
Introduction • More sophisticated assessment techniques are now available for environmental assessment • The recent development of the computer modelling techniques using Geographical Information System (GIS) has assisted the development of assessment tools for EIA • Regional Air Quality Model • Noise Mapping Software • GIS-based Habitat Map
Air quality models for EIA • simple Gaussian dispersion models • other numerical models (plume/puff models of various complexity) • physical modelling (wind tunnel) • regional photochemistry air dispersion model
Pollutants in the Atmosphere and their Transport over Hong Kong (PATH) • PATH Modelling System commissioned by EPD in 1996 and delivered in 2001 • state-of-the-art system, custom-built for HK from existing US components and thoroughly validated
AIVS Aircraft Inventory Verification Study • Airborne meteorological and air quality measurements • A total of 14 flights in November 1997 • Results used in PATH verification • Comparison of pollutant fluxes on the inflow and outflow • SAR borders provides a check on the total HK emissions
PATH modelling domains • five nested domains • grid spacing of 0.5, 1.5, 4.5, 13.5, 40.5 km • 49 x 49 grids and recently extended to 97 x 97 grids • unequally spaced vertical layers extend up to 25 km a.g.l. The lowest layer only 20 m deep
SAQM 49x49 nested grids
Emissions • comprehensive HKSAR and regional emissions databases • separate datasets for: • point sources • motor vehicles • marine emissions • biogenic emissions • all other area sources
Example: wind field & O3 concentrations 20 August 1996 4.5 km grid
Examples of Regional Air Quality Modelling for SEA • Site search and EIA for the proposed HEC 1800 MW power plant at Lamma Extension • CTS-3 SEA: Assess impacts of different vehicular emissions control measures, and different transport and population development scenarios by means of comprehensive air quality modelling • PATH was used to assist in the development of emission control strategy for the Pearl River Delta Region
HEC 1800MW Power Station EIA Study • PATH modelling of HKSAR air quality impacts • several emissions scenarios developed • AQO compliance demonstrated for the worst case meteorological scenario (1 hr and 24 averages) and by means of the PATH ‘annual average episodes’
Base case SO2 time series for 26-28 June 1995, assumed as the worst-case scenario for the HEC power station EIA
SEA for the Third Comprehensive Transport Study (CTS-3) • many transport and population development scenarios tested • detailed, 10 vehicle-class traffic forecast for each model grid cell used to estimate vehicular emissions under different growth scenarios • separate scaling up or down of other emissions (power stations, area sources, marine) • innovative use of model results for assessment: modelled increments (2016 scenario – 1997 base case) added to actually measured 1997 concentrations
NO2 annual conc. 2016 – 1997 high growth (high end) CTS-3 scenario
Noise Exposure System • ERM was commissioned by EPD in 2000 to undertake a two years Study “Investigation Study for Review of the Acoustical Environment Due to Infrastructure Projects in Hong Kong (Contract 39/2000)” • The worldwide trend to communicate environmental noise information to the public
Requirements of the Noise Exposure Model • Collate noise information for the territory • Identify and quantify the scale of noise problems • Evaluate the effectiveness of mitigation measures
Data Inventory for the NES • Digital Elevation Model (DEM) • Road Network (Linked to BDTM and ATC data) • Building Locations and Heights • Podiums • Enclosures • Barriers • Ground Surface • Weather Stations • Noise Grids for 4 heights for Lden, Ln, Ld, Le and L10
Some Statistics…. • 2,000km trafficable road (>2,000 AADT) • ~1,100 km2 study area • 6.8M inhabitants • 80,000 residential buildings • 0 – ~1,000 m elevation
Railway tracks Road centreline Airport Building footprints Podiums Barriers Enclosures Spot heights Contour lines Rivers Slope tops/bottoms Vegetation (ground absorption) Processing Overview Input Processing Output Obstacles Noise Exposure Software Level of exposure estimated for various areas G I S Emitters Decisions made on mitigation/planning based on results Calculates noise levels in different areas using inputs Traffic Model • # of vehicles • Speed • Vehicle weight
4m above ground 18m above ground 40m above ground 80m above ground
Noise Exposure • Project requirement to estimate percentage of population exposed to excessive noise • Assigning noise levels to each building facades • Data used include Census Map and Building Type Dataset • Use street block population data and building block volume to estimate number of people affected
No. of People Exposed to Road Traffic Noise Levels > 70 dB(A)
Summary • One of the largest scale noise mapping exercises in the world • Integrated GIS and Noise Model for better visualisation of the noise environment • A very useful tool/platform to develop 3D graphical presentation of information to encourage public participation
Habitat Type Freshwater/Brackish Wetland Fishpond/Gei Wai Mangrove Seagrass Bed Fung Shui Forest Intertidal Mudflat Natural Watercourse Lowland Forest
Ecological Assessment for NENT Study • Effects on Species of Conservation Concern • Habitat fragmentation/ isolation • Noise/ human disturbance • Water quality • Determine amount of habitat lost • Refer to total habitat in area of Hong Kong • Ecological value of habitat • Presence of rare species
Conclusions • GIS based assessment tools are non-dispensable tools in strategic environmental assessment and planning • PATH is a useful tool to compare air quality impact from different development scenarios and to develop control strategies • Noise exposure system is capable of producing population exposure forecast for different districts for future land use planning • GIS-based habitat map is used to provide calculation of habitat loss for assessment of the potential ecological impact for strategic environmental assessment