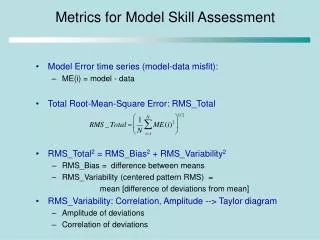
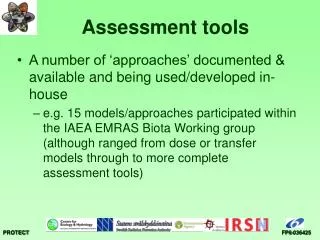
LAS tools for model assessment
This presentation at the ESG All Hands Meeting introduces innovative tools for model assessment, emphasizing the "SlideSorter" for comparing anomalies and changes against baselines using GHRSST blended satellite data. The session covers server-side data reduction techniques, including averaging and variability analyses, with practical examples using ICOADS data. Participants will also explore on-the-fly animations and how to effectively share outcomes via Google Earth, enhancing community engagement. This session demonstrates how LAS and other technologies streamline data processing and visualization.

LAS tools for model assessment
E N D
Presentation Transcript
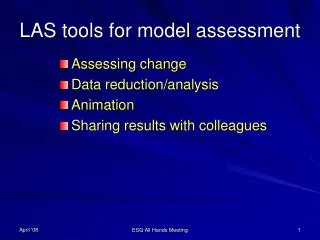
LAS tools for model assessment • Assessing change • Data reduction/analysis • Animation • Sharing results with colleagues ESG All Hands Meeting
A tool for model assessment “SlideSorter”Assessing change from a baseline compute anomaly from upper left frame … GHRSST blended satellite data 2007,Sept. 1, 3, 5, 7 ESG All Hands Meeting
A tool for model assessment SlideSortersupports comparison along all axes, including the “ensemble” axis ESG All Hands Meeting
Server-side data reduction:averaging, extrema, variability Example: compute the average over an area of the Pacific similarly transform the data along the other axese.g. request a map of time-variability ICOADS data served by OPeNDAP from NOAA/ESRL ESG All Hands Meeting
Animations Generated on-the-fly. Custom. Animate maps, sections, line plots, etc. GHRSST blended satellite data from NODC & JPL ESG All Hands Meeting
Share outputs with a broader communityvia Google Earth Data viewable through Google Earth (served remotely from NASA/JPL(*)) Data resolution increases dynamically as we zoom in. ESG All Hands Meeting
LocalData OGC (WMS, WCS) & OPeNDAP output Live Access Server (LAS)a “workflow engine”: reads data/makes products LAS Product Server Metadata(XML) user interface Backend Service Backend Service Backend Service product Productsfrom e.g. Matlab, Ferret, WMS, … Remote Data product request XML (REST) UI Metadata (AJAX) back endrequest (SOAP)