Download
1 / 52
520 likes | 839 Views
STAT 101 Dr. Kari Lock Morgan. Hypothesis Testing: Significance. SECTION 4.3, 4.5 Significance level (4.3) Statistical conclusions (4.3) Type I and II errors (4.3) Statistical versus practical significance (4.5) Multiple testing (4.5). Review of Last Class.

E N D
STAT 101 Dr. Kari Lock Morgan Hypothesis Testing: Significance • SECTION 4.3, 4.5 • Significance level (4.3) • Statistical conclusions (4.3) • Type I and II errors (4.3) • Statistical versus practical significance (4.5) • Multiple testing (4.5)
Review of Last Class • The randomization distribution shows what types of statistics would be observed, just by random chance, if the null hypothesis were true • A p-value is the chance of getting a statistic as extreme as that observed, if H0 is true • A p-value can be calculated as the proportion of statistics in the randomization distribution as extreme as the observed sample statistic • The smaller the p-value, the strongerthe evidence against H0
p-value and H0 • Which of the following p-values gives the strongest evidence against H0? • 0.005 • 0.1 • 0.32 • 0.56 • 0.94
p-value and H0 • Which of the following p-values gives the strongest evidence against H0? • 0.22 • 0.45 • 0.03 • 0.8 • 0.71
p-value and H0 • Two different studies obtain two different p-values. Study A obtained a p-value of 0.002 and Study B obtained a p-value of 0.2. Which study obtained stronger evidence against the null hypothesis? • Study A • Study B
Formal Decisions • If the p-value is small: • REJECT H0 • the sample would be extreme if H0 were true • the results are statistically significant • we have evidence for Ha • If the p-value is not small: • DO NOT REJECT H0 • the sample would not be too extreme if H0 were true • the results are not statistically significant • the test is inconclusive; either H0 or Ha may be true
Formal Decisions • A formal hypothesis test has only two possible conclusions: • The p-value is small: reject the null hypothesis in favor of the alternative • The p-value is not small: do not reject the null hypothesis How small?
Significance Level p-value < Reject H0 p-value > Do not Reject H0 • The significance level, , is the threshold below which the p-value is deemed small enough to reject the null hypothesis
Significance Level • If the p-value is less than , the results are statistically significant, and we reject the null hypothesis in favor of the alternative • If the p-value is not less than , the results are not statistically significant, and our test is inconclusive • Often = 0.05 by default, unless otherwise specified
Red Wine and Weight Loss • Resveratrol, an ingredient in red wine and grapes, has been shown to promote weight loss in rodents, and has recently been investigated in primates (specifically, the Grey Mouse Lemur). • A sample of lemurs had various measurements taken before and after receiving resveratrol supplementation for 4 weeks BioMed Central (2010, June 22). “Lemurs lose weight with ‘life-extending’ supplement resveratrol. Science Daily.
Red Wine and Weight Loss In the test to see if the mean resting metabolic rate is higher after treatment, the p-value is 0.013. Using = 0.05, is this difference statistically significant? (should we reject H0: no difference?) • Yes • No
Red Wine and Weight Loss In the test to see if the mean body mass is lower after treatment, the p-value is 0.007. Using = 0.05, is this difference statistically significant? (should we reject H0: no difference?) • Yes • No
Red Wine and Weight Loss In the test to see if locomotor activity changes after treatment, the p-value is 0.980. Using = 0.05, is this difference statistically significant? (should we reject H0: no difference?) • Yes • No
Red Wine and Weight Loss In the test to see if mean food intake changes after treatment, the p-value is 0.035. Using = 0.05, is this difference statistically significant? (should we reject H0: no difference?) • Yes • No
Elephant Example • H0 : X is an elephant • Ha : X is not an elephant • Would you conclude, if you get the following data? • Xwalks on two legs • X has four legs
Never Accept H0 • “Do not reject H0” is not the same as “accept H0”! • Lack of evidence against H0 is NOT the same as evidence for H0! “For the logical fallacy of believing that a hypothesis has been proved to be true, merely because it is not contradicted by the available facts, has no more right to insinuate itself in statistical than in other kinds of scientific reasoning…” -Sir R. A. Fisher
Statistical Conclusions In a hypothesis test of H0: = 10 vs Ha: <10 the p-value is 0.002. With α = 0.05, we conclude: • Reject H0 • Do not reject H0 • Reject Ha • Do not reject Ha
Statistical Conclusions In a hypothesis test of H0: = 10 vs Ha: < 10 the p-value is 0.002. With α = 0.01, we conclude: • There is evidence that = 10 • There is evidence that < 10 • We have insufficient evidence to conclude anything
Statistical Conclusions In a hypothesis test of H0: = 10 vs Ha: <10 the p-value is 0.21. With α = 0.01, we conclude: • Reject H0 • Do not reject H0 • Reject Ha • Do not reject Ha
Statistical Conclusions In a hypothesis test of H0: = 10 vs Ha: < 10 the p-value is 0.21. With α = 0.01, we conclude: • There is evidence that = 10 • There is evidence that < 10 • We have insufficient evidence to conclude anything
Statistical Conclusions Formal decision of hypothesis test, based on = 0.05 : Informal strength of evidence against H0:
Multiple Sclerosis and Sunlight • It is believed that sunlight offers some protection against multiple sclerosis, but the reason is unknown • Researchers randomly assigned mice to one of: • Control (nothing) • Vitamin D Supplements • UV Light • All mice were injected with proteins known to induce a mouse form of MS, and they observed which mice got MS Seppa, Nathan. “Sunlight may cut MS risk by itself”, Science News, April 24, 2010 pg 9, reporting on a study appearing March 22, 2010 in the Proceedings of the National Academy of Science.
Multiple Sclerosis and Sunlight • For each situation below, write down • Null and alternative hypotheses • Informal description of the strength of evidence against H0 • Formal decision about H0, using α = 0.05 • Conclusion in the context of the question • In testing whether UV light provides protection against MS (UV light vs control group), the p-value is 0.002. • In testing whether Vitamin D provides protection against MS (Vitamin D vs control group), the p-value is 0.47.
Multiple Sclerosis and Sunlight • In testing whether UV light provides protection against MS (UV light vs control group), the p-value is 0.002.
Multiple Sclerosis and Sunlight • In testing whether Vitamin D provides protection against MS (Vitamin D vs control group), the p-value is 0.47.
Errors • There are four possibilities: Decision TYPE I ERROR Truth TYPE II ERROR • A Type I Error is rejecting a true null (false positive) • A Type II Error is not rejecting a false null (false negative)
Red Wine and Weight Loss • In the test to see if resveratrol is associated with food intake, the p-value is 0.035. • If resveratrolis not associated with food intake, a Type I Error would have been made • In the test to see if resveratrol is associated with locomotor activity, the p-value is 0.980. • If resveratrol is associated with locomotor activity, a Type II Errorwould have been made
Analogy to Law A person is innocent until proven guilty. Evidence must be beyond the shadow of a doubt. Types of mistakes in a verdict? Convict an innocent Release a guilty
Probability of Type I Error Distribution of statistics, assuming H0 true: • If the null hypothesis is true: • 5% of statistics will be in the most extreme 5% • 5% of statistics will give p-values less than 0.05 • 5% of statistics will lead to rejecting H0 at α= 0.05 • If α = 0.05, there is a 5% chance of a Type I error
Probability of Type I Error Distribution of statistics, assuming H0 true: • If the null hypothesis is true: • 1% of statistics will be in the most extreme 1% • 1% of statistics will give p-values less than 0.01 • 1% of statistics will lead to rejecting H0 at α= 0.01 • If α = 0.01, there is a 1% chance of a Type I error
Probability of Type I Error • The probability of making a Type I error (rejecting a true null) is the significance level, α
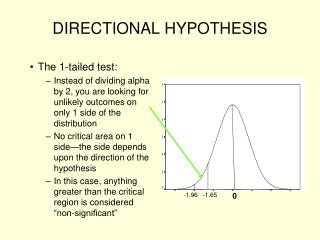
Probability of Type II Error • How can we reduce the probability of making a Type II Error (not rejecting a false null)? Option 1: • Decrease the significance level • Increase the significance level Option 2: • Decrease the sample size • Increase the sample size
Probability of Errors • The probability of making a Type I error (rejecting a true null) if the null is true is the significance level, α • The probability of making a Type II error (not rejecting a false null) if the alternative is true depends on the significance level and the sample size (among other things) • α should be chosen depending how bad it is to make a Type I or Type II error
Choosing α • By default, usually α = 0.05 • If a Type I error (rejecting a true null) is much worse than a Type II error, we may choose a smaller α, like α = 0.01 • If a Type II error (not rejecting a false null) is much worse than a Type I error, we may choose a larger α, like α = 0.10
Significance Level • Come up with a hypothesis testing situation in which you may want to… • Use a smaller significance level, like = 0.01 • Use a larger significance level, like = 0.10
Statistical vs Practical Significance • With small sample sizes, even large differences or effects may not be significant • With large sample sizes, even a very small difference or effect can be significant • A statistically significant result is not always practically significant, especially with large sample sizes
Statistical vs Practical Significance • Example: Suppose a weight loss program recruits 10,000 people for a randomized experiment. • A difference in average weight loss of only 0.5 lbs could be found to be statistically significant • Suppose the experiment lasted for a year. Is a loss of ½ a pound practically significant?
Diet and Sex of Baby • Are certain foods in your diet associated with whether or not you conceive a boy or a girl? • To study this, researchers asked women about their eating habits, including asking whether or not they ate 133 different foods regularly • A significant difference was found for breakfast cereal (mothers of boys eat more), prompting the headline “Breakfast Cereal Boosts Chances of Conceiving Boys”. • http://www.newscientist.com/article/dn13754-breakfast-cereals-boost-chances-of-conceiving-boys.html
“Breakfast Cereal Boosts Chances of Conceiving Boys” I’m had identical twin boys a year ago, and I eat breakfast cereal every morning. Do you think this helped to boost my chances of having boys? • Yes • No • Impossible to tell
Hypothesis Tests For each of the 133 foods studied, a hypothesis test was conducted for a difference between mothers who conceived boys and girls in the proportion who consume each food • If there are NO differences (all null hypotheses are true), about how many significant differences would be found using α = 0.05? • How might you explain the significantdifference for breakfast cereal?
Multiple Testing When multiple hypothesis tests are conducted, the chance that at least one test incorrectly rejects a true null hypothesis increases with the number of tests. If the null hypotheses are all true, α of the tests will yield statistically significant results just by random chance.
www.causeweb.org Author: JB Landers
Multiple Comparisons • Consider a topic that is being investigated by research teams all over the world • Using α = 0.05, 5% of teams are going to find something significant, even if the null hypothesis is true
Multiple Comparisons • Consider a research team/company doing many hypothesis tests • Using α = 0.05, 5% of tests are going to be significant, even if the null hypotheses are all true
Multiple Comparisons • This is a serious problem • The most important thing is to be aware of this issue, and not to trust claims that are obviously one of many tests (unless they specifically mention an adjustment for multiple testing) • There are ways to account for this (e.g. Bonferroni’s Correction), but these are beyond the scope of this class
Publication Bias • publication biasrefers to the fact thatusually only the significant results get published • The one study that turns out significant gets published, and no one knows about all the insignificant results • This combined with the problem of multiple comparisons, can yield very misleading results
Jelly Beans Cause Acne! http://xkcd.com/882/