Download
1 / 19
190 likes | 212 Views
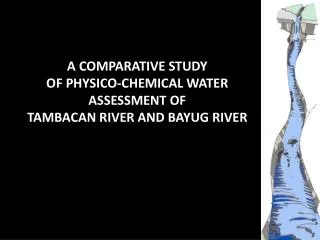
Investigating mercury levels in two rivers to assess environmental impact and management implications in the San Francisco Bay region.

E N D
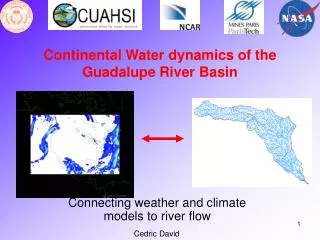
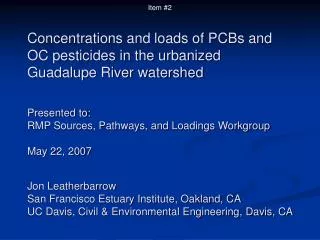
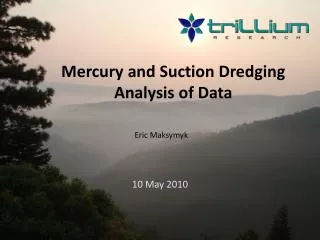
Comparative Analysis of Loads of Mercury in Coyote Creek and Guadalupe River Lester McKee RMP SPLWG Chair San Francisco Estuary Institute lester@sfei.org
Coyote Creek USGS discharge WY 1999 – 2006 (ongoing) USGS suspended sediment WY 2005 WY 2006 Regional Board TMDL laboratory funding ($10k) WY 2005 PCB, PBDE, HgT, SSC, organic carbon Data SFEI field team able to grab 7 samples during wading stage only during breaks from Guadalupe R. sampling Guadalupe River USGS discharge WY 1929 – 2006 (ongoing) USGS/SFEI suspended sediment WY 2003 – 2006 (ongoing) Funding WY 2003 CEP WY 2004 CEP / RMP WY 2005 RMP / SCVWD / USACE / SCVURPPP Data HgT, HgD, MeHgT, MeHgD, Bedload HgT Acknowledgements and Data Sources
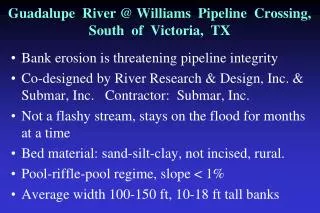
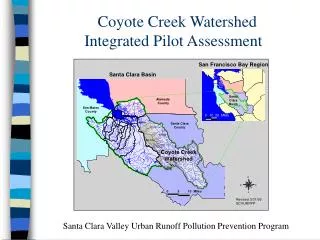
Coyote Ck. at Hwy 237 USGS 11172175 Area: 826 km2 Guadalupe R. at Hwy 101 USGS 11169026 Area: 414 km2 Coyote Ck. Guadalupe R. Field Locations
Sampling Location USGS Gage Shelter Methods
Total Mercury v Suspended Sediment(Runoff from Upper and Lower Watershed)
Loads Calculation Methods(WY 2005) • USGS 15 minute discharge • USGS 15 minute SSC estimates from GCLASS based on rating relationships between flow and about 100 real measurements of SSC • Regression between instantaneous SSC and Total Mercury concentrations • All data • Separate regressions for water derived from Lower and Upper watershed
Measured Estimated Average = 41 Mm3 Estimated Average - Methods
Estimated Average Coyote Loads • Using the range in flow experienced from WY 1971 to WY 2006 we estimate the following:
Particle ConcentrationsCoyote Ck, Guadalupe R. and Sacramento R.
Applicable Management Questions B. Loads of mercury and methylmercury • Are current estimates about loading to San Francisco Bay from watersheds, wastewater treatment facilities, and atmosphere valid? • What is the contribution of atmospheric deposition to urban storm water?
Applicable Management Questions C. Processes of mercury methylation • What is the relative bioavailability of mercury entering the Bay from various loading sources (e.g., wastewater treatment facilities, atmosphere, urban runoff, tributaries, newly eroded historic sediments, etc)?
Applicable Management Questions D. Given what we currently understand about processes, loads, and impacts (Sections A, B, and C), what are the management implications? • Given that rivers, creeks, and storm drains discharge methyl mercury, what can be done to manage production in the watershed and urban environments, and to manage downstream impacts as it passes through wetlands to the Bay margin and Bay?