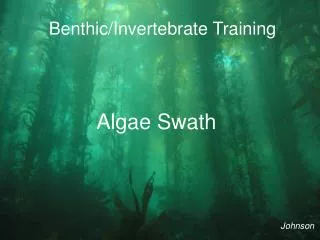
PISCO Invertebrate and Algae Sampling Methods Training 2016
430 likes | 491 Views
PISCO Invertebrate and Algae Sampling Methods Training 2016. 2015 PISCO Training Overview for Invertebrates and Algae. PISCO Annual Survey Design Swath survey method UPC method New benthic transect protocol Swath and UPC ID slides. Annual Survey Design. When.

PISCO Invertebrate and Algae Sampling Methods Training 2016
E N D
Presentation Transcript
PISCO Invertebrate and Algae Sampling Methods Training 2016
2015 PISCO Training Overview for Invertebrates and Algae • PISCO Annual Survey Design • Swath survey method • UPC method • New benthic transect protocol • Swath and UPC ID slides
Annual Survey Design When 2015: June through September Where • Different oceanographic regimes • Lower upwelling – Southern Monterey Bay • Higher upwelling – Point Lobos, Carmel Bay • 2. Marine protected areas and “paired” comparison sites • Lover’s Point SMR, Ed Ricketts SMCA, Pacific Grove Marine Gardens SMCA • Point Lobos SMR, Pescadero Point, Soberanes
Fish transects at 5, 10, 15 and 20m Benthic transects at 5, 12.5 and 20m Example schematic diagram of stratified random permanent sampling design. Pacific Grove Marine Gardens SMCA Asilomar SMR Existing PISCO long term monitoring unit New randomly selected monitoring unit ’89 ’99 ’02 Composite Kelp 2005 Kelp 100m buffer from reserve boundary
Fish transects at 5, 10, 15 and 20 m Benthic transects at 5, 12.5 and 20 m Schematic diagram of depth-stratified sampling design
Annual Surveys – Benthic Sampling Design 1999 …… 20?? Time Site 1 2 3 25 …… 1 2 Area Zone (5 m, 12.5 m, 20 m) S M D Transects: 2
Annual Surveys: Spatial Sampling Design • Spatial (depth) stratification: • Shallow (S) = 5 m, Mid (M) = 12.5 m, Deep (D) = 20 m • designed to assure that all depth zones are representatively sampled for description of invert and algae assemblages. • 2. Also to assure representative sampling from outer to inner edges of the reef! • If reef depths are constrained (e.g., 5-10 m), then sampling is distributed from outer to inner edges of reef including comparable depths (when possible) to those above (e.g., 5 and 10 m), plus additional depth strata to assure coverage from inner to outer edges of the reef.
1 meter 1 meter Swath Surveys Swaths should extend one meter on either side of the transect line. Top view of transect Transect line Maintain reasonable speed (~20 minutes per transect) and only count invertebrates 2.5 cm or larger in diameter (except urchins and certain sea stars)
Swath Surveys Swaths extend one meter on either side of the transect line as if draped over the substrate—remember, you want to cover 60 square meters of surface area Imagined 1 m extension on both sides of the transect tape Transect line End-on view of transect
SUB-SAMPLING in each 10 m segment Once 30 individuals of a species are counted, indicate the distance you have sampled within that 10 m segment (NOT THE METER MARK!) and discontinue counting until you reach the next 10 m segment. For example, if you count 34 Styela from the 20 m mark to the 17.5 m mark, then you note 34 @ 2.5 m. Be sure to count all individuals in the rectangle you sample, even if it is slightly over 30, since the goal is an estimate of density within a rectangular area.
Use a flashlight at all times when surveying for swath invertebrates to make sure organisms in cracks and crevices are accounted for
Note health status for sea stars. * = mild disease ** = severe *(II, 3, E) Swath diver measures sea star ray length for certain species.
>6cm Algae are also counted using Swath techniques. Count all individuals 30 cm or larger, except Macrocystis and Nereocystis (>1 m) and Cystoseira (>6 cm diameter). 1m Efird
UPC Surveys Uniform Point Contact Data are collected every 1 m along the 30 m transect tape Top view of transect Transect line 1 meter Transect tapes are marked at 1 m increments
UPC Surveys Uniform Point Contact Remember not to bias your data! Look once and pick the point, do not “look around.”
Colonial tunicate on a solitary tunicate Lonhart/MBNMS If your point falls on a mobile invertebrate or epibiont, ignore it and make sure you are recording the organism underneath it that isdirectly attached to the substrate! (Note, it need not be attached under the point, elsewhere is ok)
A C B Sponge Red branching Green algae
Each 10 m segment contains10 data pointsfor each of three categories (substrate, relief, point): Substrate Relief Superlayer (special category) Point
A C B Sponge Red branching Red branching & possible superlayer for juvenile laminariales (if it is one)
Substrate type Barlotti
Superlayer – The special category The SUPERLAYER category counts things that have an impact on cover, but are not counted on the data sheet. Examples are drift algae and juvenile laminariales. After marking the presence of the superlayer, move the algae and record the primary substrate holder. Figurski Figurski You do not need 30 points in this category!
Reliefis the absolute difference in elevation between the highest and lowest point within a 1 m by 0.5 m rectangle Top view of transect Transect line 1 meter 0.5 meter
Reliefis determined within non-overlapping rectangles (1 m by 0.5 m) as depicted below Top view of transect Transect line 1 meter 0 1 2 0.5 m The rectangle is centered on the UPC point. Each rectangle extends 0.5 m on both sides of the tape, and 0.25 m in front of and behind the point along the tape.
The rectangle for relief does NOT conform to the surface. Imagine it is a rectangular column along the plane of the tape and extending infinitely into the earth and up to the sky. Top view of transect Transect line 0 1 2 Within this rectangle you must look for the highest and lowest points, then determine the vertical distance between the two.
Reliefis binned into four categories: 0-0.1 m, 0.1-1 m, 1-2 m, and >2 m. The red line shown below is the imaginary rectangle (0.5 m along the tape in total, 1 m perpendicular to the tape in total) that is level relative to the earth’s surface and extends into rock and out into water as necessary. Transect line End-on view of transects
Each 10 m segment contains10 data points At the end of the 30 m you should have 30 points in three categories (i.e. substrate, relief, and point) sand, cobble, boulder, bedrock Substrate Relief 0-0.1, 0.1-1, 1-2, >2 m Superlayer (special category) Drift or juvenile laminariales What was under the point, live or dead Point
2016 Benthic Transect Protocol Three diver system: UPC diver, swath diver, and AbU diver There will be three divers. In addition to UPC (black) and swath (green) divers, there is also an abalone-urchin (purple) diver, aka AbU. The AbU diver collects size-frequency data for both red and purple urchins as well as three abalone species.
Phase 1: Reeling out tape • UPC diver reels out tape, follows heading but maintains target depth; • The AbU diver follows; • The swath diver starts counting invertebrates at the 0 m mark but excludes abalone and urchins.
Phase 2: Everyone collecting invert data • UPC diver secures tape, then starts UPC; • The AbU diver follows UPC diver to collect data in 2 m wide swath, sizing (cm) purple and red urchins and abalone. AbU diver can pass UPC diver if necessary; • Check in with swath diver as you pass. Swath diver collects invert data and sea star wasting data.
Phase 3: Swath algae data Usually UPC is done first, then starts collecting swath algae data from the 0 m end and is working towards the swath diver. When they meet, they note the point that they have sampled, then one of them retrieves the tape and reels it in until they encounter the AbU diver or the end of the tape. If the swath diver is still on inverts, the UPC divers does all algae and begins to reel tape in until encountering one of the other divers.
Subsampling reminder! • AbU diver: • Within each 10 m segment, if you reach 30 or more individuals of a single species, note how many were counted followed by the distance covered (e.g., 32 at 2.7 m). • You start over in the next 10 segment. • Be sure to finish the entire ‘rectangle’ so we capture an accurate density estimate.
Record the distance you covered This applies to collecting swath data. For a subsample, record the distance sampled within the 10 m segment to the nearest 0.1 m. Below, the diver started at 30 m and counted 33 Pterygophora by the 26.2 m mark, thereby sampling a rectangle 3.8 m long. Record this as: 33 @ 3.8 m. 30 29 28 27 26 25 24 23
AbU diver: measuring abalone shell length and the diameter of an urchin test Measure greatest shell length (nearest cm) for each abalone encountered in the 2 m wide swath. Urchin diameter is for the test (i.e. shell) and does not include the spines.
Swathdiver: measuring sea star radius Measure length (nearest cm) for TARGET sea stars encountered in the 2 m wide swath. Measure along the aboral surface, from the center of the medial disc to the tip of the single longest ray. Remove the star if easy to do, otherwise measure in place. Note disease status (* = mild, ** = dissolving)
1 2 3 4 5 6 7 1 2 3 4 5 6 7 1 2 3 4 5 6 7 Measure to the nearest cm (without bias)
Safety Considerations • Dive profiles- approved by DSO- well within no-decompression limits- maximum depth 20 m- 3-5 min safety stops mandatory on dives >10 m • Air consumption- safety over data collection (500 psi @ surface) • Buddy system- members of a dive team are always in contact via the transect line • Sea conditions- diving will only be conducted in good conditions
Dive Safety Brief 1.Dive log - sign out and in 2.Dive procedures - ascent rate 1 ft per 2 sec - deep-shallow - maintain dive team 3.On board communications: cell phone, VHF Ch 16 (Paragon), & SPOT system 4. First Aid & Oxygen - Shore and vessel 5.Evacuation plan: this is developed for each site and must be covered prior to the dive