Shifting Supply, Demand, and Equilibrium
280 likes | 526 Views
Shifting Supply, Demand, and Equilibrium. Fall 2013. Reasons for Changes in Demand. Assume that Demand Curve B represents the baseline (original) annual consumption of U.S.-made cars. For each of the following scenarios, decide: Will this event cause a shift in the demand curve?

Shifting Supply, Demand, and Equilibrium
E N D
Presentation Transcript
Shifting Supply, Demand, and Equilibrium Fall 2013
Reasons for Changes in Demand Assume that Demand Curve B represents the baseline (original) annual consumption of U.S.-made cars. For each of the following scenarios, decide: Will this event cause a shift in the demand curve? If so, will the demand increase or decrease? Which demand curve likely represents the new demand for cars?
Scenario 1: Consumers’ Income Drops This is a Change in Income. Because they will have less money to go around, consumers will buy fewer cars – regardless of price. As a result, the demand curve will shift left to Curve A – representing the decrease in demand.
Scenario 2: Millions of Immigrants Enter the U.S. This is a Change in the Number of Consumers. Because there will be more consumers to buy (regardless of price concerns), sales of automobiles will increase. As a result, the demand curve will shift right to Curve C – representing the increase in demand.
Scenario 3: Price of Foreign Autos Drop This is a Change in the Price of a Substitute Good. Consumers will be more likely to buy the foreign cars, reducing the demand for domestic (U.S.-made) automobiles. As a result, the demand curve will shift left to Curve A – representing the decrease in demand.
Scenario 4: Major Cities Add Inexpensive Bus Lines This is a Change in the Price of a Substitute Good. Consumers will be more likely to ride public transportation, reducing the demand for cars. As a result, the demand curve will shift left to Curve A – representing the decrease in demand.
Scenario 5: Price of U.S. Autos Rises While people will buy fewer cars as a result of the increase in price, this is movement along the original curve – so there is no shift. The graph of car demand stays at Curve B.
Scenario 6: Price of U.S. Autos Expected to Rise Soon This a Change in Expectations. Because they anticipate rising prices to come, consumers will choose to buy now. As a result, the demand curve will shift right to Curve C – representing the increase in demand.
Scenario 7: Families Look Forward to Summer Vacations This a Change in Expectations. Consumers are looking forward to greater utility of cars in the near future. (Road trip!) Therefore, they shop for a new car. As a result, the demand curve for cars shifts right to Curve C – representing the increase in demand.
Scenario 8: U.S. Auto Firms Launch Effective Ad Campaigns This is a Change in Tastes. The U.S. auto industry is able to convince consumers that they should be American-made, thus increasing sales. As a result, the demand curve shifts right to Curve C – representing the increase in demand.
Reasons for Changes in Supply Assume that Supply Curve B represents the baseline (original) supply of U.S.-made cars. For each of the following scenarios, decide: Will this event cause a shift in the supply curve? If so, will the supply increase or decrease? Which supply curve likely represents the new supply for foreign and domestic cars?
Scenario 1: Auto Workers’ Union Agrees to Wage Cuts This is a Change in Input Prices. Because they’ll be able to pay their workers less, this reduces the unit cost to produce cars – so suppliers have an impetus to produce more. As a result, the supply curve will shift to the right to Supply Curve C – representing the increase in supply.
Scenario 2: New Robot Technology Increases Efficiency This is a Change in Technology (which is also an Input). Because they’ll be able to produce cars more efficiency, this reduces the unit cost to produce cars – so suppliers have an impetus to produce more. As a result, the supply curve will shift to the right to Supply Curve C – representing the increase in supply.
Scenario 3: Price of U.S. Cars Increases While producers will make more cars as a result of the increase in price, this is movement along the original curve – so there is no shift. The graph of car supply stays at Curve B.
Scenario 4: Nationwide Auto Workers Strike Begins This is a Change in the Number of Producers. The strike will eliminate domestic automakers from car production, so fewer suppliers will be producing – and fewer cars are being produced. As a result, the supply curve will shift to the left to Supply Curve A – representing the decrease in supply.
Scenario 5: Cost of Steel Rises This is a Change in Input Prices. Because they’ll have to pay more for steel used in production, this increases the unit cost to produce cars – so suppliers choose to produce less. As a result, the supply curve will shift to the left to Supply Curve A – representing the decrease in supply.
Scenario 6: Major Auto Producer Goes Out of Business This is a Change in the Number of Producers. The plant closing will remove this automaker from car production, so fewer suppliers will be producing – and fewer cars are being produced. As a result, the supply curve will shift to the left to Supply Curve A – representing the decrease in supply.
Scenario 7: Buyers Reject New Car Models This is movement along the original curve, so there is no shift. This is a shift in demand, not supply. The graph of car supply stays at Curve B.
Scenario 8: Government Gives Car Producers a Subsidy This is a Change in Input Prices. The government subsidy will decrease the overall cost of operations for the automobile industry, making it more profitable to produce more cars. As a result, the supply curve will shift right to Curve C – representing the increase in supply.
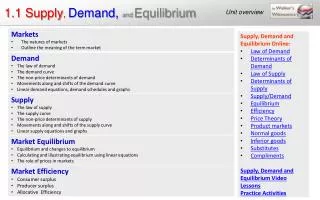
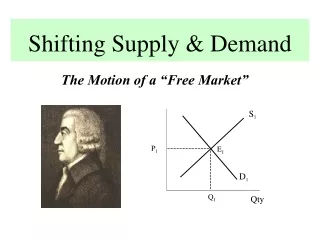
Determining Equilibrium Putting Supply and Demand together shows the actual price at which a good is bought and sold. Market equilibrium – when the price has moved to a level at which the quantity of a good demanded equals the quantity of that good supplied.
Finding Equilibrium Price and Quantity The easiest (and best) way to determine equilibrium price and quantity in a market is by putting the supply curve and demand curve on the same diagram. The price and quantity where they intersect is equilibrium.
Why is Equilibrium Achieved? In well-established markets in which there is information available about other trades that have taken place, a market price emerges. When prices rise above equilibrium, producers are willing to supply more – but consumers are unwilling to buy more. When prices fall below equilibrium, buyers are willing to buy more – but producers are unwilling to produce a sufficient amount at this price.