Download
1 / 60
610 likes | 830 Views
1.1 Supply , Demand, and Equilibrium. U nit o verview. 1.1 Supply , Demand, and Equilibrium. Markets. Markets – where buyers and sellers meet

E N D
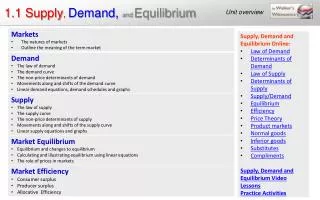
1.1 Supply, Demand, and Equilibrium Unit overview
1.1 Supply, Demand, and Equilibrium Markets Markets – where buyers and sellers meet Recall from your introductory unit that the market system is that which most economies today are based on. Markets come in many forms, but most can be characterized as one of the following
1.1 Supply, Demand, and Equilibrium Markets Markets in the Circular Flow Model The first economic model you learned was that which shows the flow of money payments between households and firms in the market economy. • Notice: • The interdependence of households and firms • The motivations for individuals to participate • To maximize their utility or happiness for households • To maximize their profits for firms • All income for households turns into revenues for firms, and vice versa.
1.1 Supply, Demand, and Equilibrium Demand • How markets work – Introduction to Demand • In order for a market to function, there must be demand for a product or a resources. But what, exactly IS demand? • Determining your own demand : • Think of your favorite candy, and ask yourself, how much of it would you be willing to buy in ONE week if it cost the following: $5, $4, $3, $2, $1. • On the table to the right, write the quantity you would buy at each of the above prices in one week. This is your weekly demand for candy.
Demand Schedules • 1.1 Supply, Demand, and Equilibrium • From Individual Demand to Market Demand • Demand is defined as the quantity of a particular good that consumers are willing and able to buy at a range of prices at a particular period of time. • The table you created is your individual demand for candy in one week. • Now choose three classmates, and assume that the four of you are the ONLY consumers of candy in a particular market. • Record all four of your demands int o the table below This is the market demand for candy in a week. The market demand is simply the sum of all the individual consumers’ demands in a market
1.1 Supply, Demand, and Equilibrium Demand Curves From the Demand table to the Demand curve The data you recorded on your own demand and the demand of three of your classmates is in what we call a demand schedule. But this data can also be plotted graphicall. • Drawing a demand curve: • First draw an x and y axis • Label the y-axis ‘P’ for price • Label the x-axis ‘Q’ for quantity • Include the prices from $1 to $5 • Include the appropriate quantities out to the highest total demand from your market • Give your graph a title • Next, plot the total quantities demanded in your market at the various prices on your graph. • What relationship do you observe between quantity and price? • Try to explain this relationship to your classmates Candy Market Price 5 4 3 2 1 Q1 Q5 Q2 Q3 Q4 Quantity
1.1 Supply, Demand, and Equilibrium Demand Curves • The Demand Curve • The chances are, the points from your demand schedule formed a scatter plot, demonstrating the following: • At higher prices, a smaller quantity of candy is demanded • At lower prices, a greater quantity of candy is demanded Candy Market Price Connect the dots! Once you have plotted the different quantities from your schedule, connect the dots, a you have the demand curve! 5 4 3 2 1 The Law of Demand: Your demand curve should demonstrate the law of demand, which states that ceteris paribus (all else equal), there is an inverse relationship between a good’s price and the quantity demanded by consumers Demand Q1 Q5 Q2 Q3 Q4 Quantity
1.1 Supply, Demand, and Equilibrium The Law of Demand Video Lesson THE LAW OF DEMAND
The Law of Demand • 1.1 Supply, Demand, and Equilibrium • The Law of Demand • The law of demand is a fundamental concept of market economies. • Rational consumers will always buy more of a good they want when the price falls, and less when the price rises. • There are three economic explanations for this phenomenon.
Changes in Demand • 1.1 Supply, Demand, and Equilibrium • Changes in Demand vs. Changes in Quantity • Using a simple demand curve, we can show the following • The effect of a change in the price of a good on the quantity that consumers demand • The effect of a change in the demand for a good (A) • A change in price leads to a change in the quantity demanded • As seen in graph (A), when the price of candy rises, a smaller quantity is demanded. • When the price of candy falls, a higher quantity is demanded. A change in price leads to a change in the quantity demanded. • A change in demand is caused by a change in a non-price determinant. • In graph (B), the entire demand curve shifts out (increases) and in (decreases) • Shifts in demand are the result in a change in a non-price determinant of demand (B)
Determinants of Demand • 1.1 Supply, Demand, and Equilibrium Changes in Demand vs. Changes in Quantity To say that “demand has increased” or “demand has decreased” is to say that the entire demand for a good has shifted outwards or inwards. Such a shift is NOT caused by a change in price, rather by one of the following
Determinants of Demand • 1.1 Supply, Demand, and Equilibrium The non-Price Determinants of Demand The “demand shifters” are those things that can cause the entire demand curve to move in or out. Consider the market for ice cream. • Tastes: If health conscious consumer begin demanding healthier desserts, demand for ice cream may shift to D2 • Other related goods’ prices: • If the price of a complementary good, ice cream cones, rises, demand will shift to D2. There is an inverse relationship between the price of complements and demand. • If the price of a substitute good, frozen yogurt, rises, demand will shift to D1. There is a direct relationship between the price of substitutes and demand • Expectations of consumers: If there is a dairy shortage expected, demand will shift to D1 (due to higher expected prices). If there is a surplus of ice cream expected, demand will shift to D2 (due to lower expected prices)
Determinants of Demand • 1.1 Supply, Demand, and Equilibrium The non-Price Determinants of Demand, continued… • Incomes: Normal vs. Inferior goods • If the ice cream in question is a normal good, then an increase in consumers income will shift demand to D1. • If ice cream is an inferior good, then an increase in consumers’ income will shift demand to D2. Inferior goods demonstrate an inverse relationship between income and demand. • Size of the market: If the population in the town where the ice cream is sold increases, demand shifts to D1 • Special circumstances: If there is a heat wave, demand shifts to D1, if the weather is unusually cold, demand will decrease to D2
Determinants of Demand • 1.1 Supply, Demand, and Equilibrium THE DETERMINANTS OF DEMAND
1.1 Supply, Demand, and Equilibrium Demand Quiz Demand – Quick Quiz Answer the following question about demand based on what you have learned so far in this unit. • Over the last week the price of petrol has decreased significantly. Using two demand graphs, show what happens to the demand for petrol and the demand for public transportation. • Illustrate and explain the impact of cheap petrol on demand for automobiles. • Identify and briefly explain three factors that will affect the demand for coffee. • How do the following concepts help explain the law of demand. • Income effect • Substitution effect
Linear Demand Equations • 1.1 Supply, Demand, and Equilibrium • Linear Demand Equations • Demand, which we have now seen expressed in both a schedule and as a curve on a diagram, can also be expressed mathematically as an equation. We will examine linear demand equations, which are simple formulas which tell us the quantity demanded for a good as a function of the good’s price and non-price determinants. • A typical demand equation will be in the form: • Where: • ‘Qd’ = the quantity demanded for a particular good • ‘a’ = the quantity demanded at a price of zero. This is the ‘q-intercept’ of demand, or where the demand curve crosses the Q-axis • ‘b’ = the amount by which quantity will change as price changes, and • ‘P’ = the price of the good
Linear Demand Equations • 1.1 Supply, Demand, and Equilibrium • Linear Demand Equations • Consider the demand for bread in a small village, which can be represented by the following equation: • What do we know about the demand for bread from this function?We know that: • If bread were free (e.g. if the price = 0), 600 loaves of bread would be demanded. Plug zero into the equation to prove that Qd=600 • For every $1 increase in the price of bread above zero, 50 fewer loaves will be demanded. Plug the following prices into the equation to prove this: • $1 - • $2 - • $3 - • $4 - • We can also calculate the price at which the quantity demanded will equal zero. This is known as the P-intercept (because it’s where the demand curve crosses the P-axis. To prove this, set Q equal to zero and solve for P.
Linear Demand Equations • 1.1 Supply, Demand, and Equilibrium • Linear Demand Equations – the demand schedule • A demand equation can be plotted in both a demand schedule and as a demand curve. In the market for bread, we already determined the following: • At a price of $0, the quantity demanded is 600 loaves. This is the q-intercept • At a price of $12, the quantity demanded is 0 loaves. This is the p-intercept • With these numbers, we can create a demand schedule Notice that for every $2 increase in the price, the quantity demanded falls by 100 loaves. This corresponds with our ‘b’ variable of 50, which tells us how responsive consumers are to price changes. For every $1 increase in price, 50 fewer loaves are demanded
Linear Demand Equations • 1.1 Supply, Demand, and Equilibrium • Linear Demand Equations – the demand curve • The data from our demand schedule can easily be plotted on a graph. OR, we could have just plotted the two points of demand we knew before creating the demand schedule. • The Q-intercept of 600 loaves, and • The P-intercept of $12 • Notice the following: • The demand for bread is inversely related to the price. This reflects the law of demand • The slope of the curve is negative, this is reflected in the equation by the ‘-’ sign in front of the ‘b’ variable. • For every $1 increase in price, Qd decreases by 50 loaves. • 50 is NOT the slope of demand, however, rather, it is the ‘run over rise’. In other words, the ‘b’ variable tells us the change in quantity resulting from a particular change in price.
Linear Demand Equations • 1.1 Supply, Demand, and Equilibrium INTRODUCTION TO LINEAR DEMAND EQUATIONS
Linear Demand Equations • 1.1 Supply, Demand, and Equilibrium • Linear Demand Equations – changes in the ‘a’ variable • As we learned earlier, a change in price causes a change in the quantity demanded. This relationship can clearly be seen in the graph on the previous slide. • But what could cause a shift in the demand curve? • And how does this affect the demand equation? • A change in a non-price determinant of demand will change the ‘a’ variable. • Assume the price of rice, a substitute for bread, falls. • Demand for bread will decrease and the demand curve will shift. • In the demand equation, this causes the ‘a’ variable to decrease. Assume the new equation is: • Now less bread will be demanded at every price. The new Q-intercept is only 500 loaves. The demand curve will shift to the left
Linear Demand Equations • 1.1 Supply, Demand, and Equilibrium Linear Demand Equations – changes in the ‘a’ variable A decrease in demand for bread caused the ‘a’ variable to decrease: • Notice the following: • At each price, 100 fewer loaves are now demanded. In the original graph, 350 loaves were demanded at $5, now only 250 are demanded. • Demand has decreased because a non-price determinant of demand changed (the price of a substitute decreased, so consumers switched to rice). • The ‘b’ variable did not change, so the slope of the demand curve remained the same. • The P-intercept decreased to $10. Now, at a price of $10, no bread is demanded, whereas before consumers would buy bread up to $12.
Linear Demand Equations • 1.1 Supply, Demand, and Equilibrium • Linear Demand Equations – changes in the ‘b’ variable • The ‘b’ variable in the demand equation is an indicator of the responsiveness of consumers to price changes. • If something causes consumers to be moreresponsive to price changes, the ‘b’ variable will increase • If something causes consumers to be less responsive to price changes, the ‘b’ variable will decrease • Assume several bakeries have shut down in the village and only one remains. Consumers now have less choice and must buy their bread form that bakery, therefore they become less responsive to price changes. The ‘b’ variable in the equation will decrease to 30 • Now, for every $1 increase in price, consumers will demand 30 fewer loaves, instead of 50. The Q-intercept will remain the same (600) but the demand curve will be steeper, indicating consumers are less responsive to price changes
Linear Demand Equations • 1.1 Supply, Demand, and Equilibrium Linear Demand Equations – changes in the ‘b’ variable The ‘b’ variable has decreased. The new demand curve should reflect this change • Notice the following: • Consumers are less responsive to price changes now. • As the price rises from $0 to $5 per loaf, now consumers will still demand 450 loaves, whereas in the original graph they would have only demanded 350 loaves. • Demand for bread has increased because there are fewer substitutes in this village. • The new P-intercept is not visible on the graph, but it can easily be calculated. Set Q to zero and solve for P • 0 • Now, at a price of $20, zero loaves will be demanded
Linear Demand Equations • 1.1 Supply, Demand, and Equilibrium LINEAR DEMAND EQUATIONS – SHIFTS IN DEMAND
1.1 Supply, Demand, and Equilibrium Supply • Introduction to Supply • All markets include buyers and sellers. The buyers in a market demand the product, but the sellers supply it. • Definition of Supply:a schedule or curve showing how much of a product producers will supply at each of a range of possible prices during a specific time period. • Different producers have different costs of production. • Some firms are more efficient than other thus can produce their products at a lower marginal cost. • Firms with lower costs are willing to sell their products at a lower price. • However, as the price of a good rises, more firms are willing and able to produce and sell their good in the market, as it becomes easier to cover higher production costs. This helps to explain… • The Law of Supply • Ceteris paribus, there exists a direct relationship between price of a product and quantity supplied. As the price of a good increases, firms will increase their output of the good. As price decreases, firms will decrease their output of the good.
1.1 Supply, Demand, and Equilibrium The Law of Supply The Law of Supply Whereas demand shows an inverse relationship with price, supply shows a direct relationship with price. • Consider the market for candy again. • An increase in the price of candy results in more candy being produced, as more firms can cover their costs and existing firms increase output. • A fall in the price of candy results in the quantity supplied falling, as fewer firms can cover their costs, they will cut back production. • Only the most efficient firms will produce candy at low prices, but at higher prices more firms enter the market Candy Market Price 5 4 3 2 1 On the graph, draw a line which illustrates the relationship between price and quantity supplied described above Q1 Q5 Q2 Q3 Q4 Quantity
1.1 Supply, Demand, and Equilibrium The Law of Supply • The Law of Supply – the supply curve • The supply curve slopes upward, reflecting the law of supply, indicating that • At lower prices, a lower quantity is supplied, and • At higher prices, firms wish to supply more candy • Notice that: • The supply curve intersects the price-axis around $1. This is because no firm would be able to make a profit selling candy for less than $1. The P-intercept of supply will almost always be greater than zero. • You cannot see where the supply curve crosses the Q-axis. This is because below $1, there is no candy supplied. The Q-intercept would, in fact, be negative. Supply Candy Market Price 5 4 3 2 1 Q1 Q5 Q2 Q3 Q4 Quantity
Determinants of Supply • 1.1 Supply, Demand, and Equilibrium The non-Price Determinants of Supply A change in price will lead to a change in the quantity demanded. But a change in a non-price determinant of supply will shift the supply curve and cause more or less output to be supplied at EACH PRICE.
Determinants of Supply • 1.1 Supply, Demand, and Equilibrium Changes in Supply vs. Changes in Quantity A change in the price of a good causes the quantity supplied to change. This is different than a change in supply, which is caused by a change in a non-price determinant of supply (A) • A change in price: Can be seen in graph (A) • Firms already in the market will with to increase their output to earn the higher profits made possible by the higher price. • If price falls, firms will scale back production to maintain profits or reduce losses. • A change in supply: Can be seen in graph (B) • If resources costs decrease, a subsidy is granted, or if the number of firms increase, supply increases to S1 • If resource costs rise, if a tax is levied, or if the price of a similar good which firms can produce rises, supply decreases to S2. (B)
Linear Supply Equations • 1.1 Supply, Demand, and Equilibrium • Linear Supply Equations • Supply can also be expressed mathematically as an equation. We will examine linear supply equations, which are simple formulas that tell us the quantity supplied of a good as a function of the good’s price and non-price determinants. • A typical supply equation will be in the form: • Where: • ‘Qs’ = the quantity supplied for a particular good • ‘c’ = the quantity supplied at a price of zero. This is the ‘q-intercept’ of supply, or where the supply curve would cross the Q-axis • ‘d’ = the amount by which quantity will change as price changes, and • ‘P’ = the price of the good
Linear Supply Equations • 1.1 Supply, Demand, and Equilibrium • Linear Supply Equations • Consider the demand for bread in the same small village as in our demand analysis, which can be represented by the following equation: • What do we know about the supply of bread from this function? We know that: • If bread were free (e.g. if the price = 0), -200 loaves of bread would be demanded. Plug zero into the equation to prove that Qs=-200 at a price of zero. Of course, -200 cannot be supplied, so if P=0, no bread will be produced. • For every $1 increase in the price of bread above zero, 150 additional loaves will be supplied. Plug the following prices into the equation to prove this: • $1 - • $2 - • $3 - • $4 - • We can also calculate the price at which the supply curve will begin. This is known as the P-intercept (because it’s where the supply curve crosses the P-axis. To find this, set Q equal to zero and solve for P.
Linear Supply Equations • 1.1 Supply, Demand, and Equilibrium • Linear Supply Equations – the Supply Schedule • A supply equation can be plotted in both a supply schedule and as a supply curve. In the market for bread, we already determined the following: • At a price of $0, the quantity demanded is -200 loaves. This is the q-intercept • At a price of $1.33, the quantity supplied is 0 loaves. This is the p-intercept • With these numbers, we can create a supply schedule Notice that as the price of bread rises from $0 to $10, the market goes from having no bread to having 1300 produced by firms. For every $1 increase in price, quantity supplied increases by 150 loaves; this corresponds with the ‘d’ variable, which is an indicator of the responsiveness of producers to price changes.
1.1 Supply, Demand, and Equilibrium Linear Supply Equations Linear Supply Equations – the Supply Curve The data from our supply schedule can easily be plotted on a graph. All we need is two points from the schedule to plot our curve. • Notice that: • The Q-intercept is not visible on our graph, since the Q-axis only goes to the origin • The P-intercept is labeled at $1.33. This indicates that until the price of bread is $1.33 per loaf, no firms will be willing to make bread. • The gradient of the curve is representative of the ‘d’ variable, which tells us that for every $1 increase in price, quantity rises by 150 loaves of bread. ‘d’ is the change in quantity over the change in price.
1.1 Supply, Demand, and Equilibrium Linear Supply Equations Video Lesson LINEAR SUPPLY EQUATIONS
Linear Supply Equations • 1.1 Supply, Demand, and Equilibrium • Linear Supply Equations – changes in the ‘c’ variable • As we learned earlier, a change in price causes a change in the quantity supplied. This relationship can clearly be seen in the graph on the previous slide. • But what could cause a shift in the supply curve? • And how does this affect the supply equation? • A change in a non-price determinant of supply will change the ‘c’ variable. • Assume the price of wheat, a key ingredient in bread, falls. • Supply of bread will increase and the supply curve will shift outward. • In the supply equation, this causes the ‘c’ variable to increase. Assume the new equation is: • Now more bread will be supplied at every price. The new Q-intercept is -100 loaves. The supply curve will shift to the right
Linear Supply Equations • 1.1 Supply, Demand, and Equilibrium Linear Supply Equations – changes in the ‘c’ variable An increase in supply of bread caused the ‘c’ variable to increase: • Notice the following: • At each price, 100 more loaves are now supplied. In the original graph, 400 loaves were supplied at $4, now 500 are supplied. • Supply has increased because a non-price determinant of supply changed (the price of an input decreased, so firms made more bread). • The ‘d’ variable did not change, so the slope of the supply curve remained the same. • The P-intercept decreased to $0.75. Now, firms are willing to start baking bread at a price of just $0.75, whereas before they would not begin making bread until the price reached $1.33.
Linear Supply Equations Video Lesson • 1.1 Supply, Demand, and Equilibrium LINEAR SUPPLY EQUATIONS
Linear Supply Equations • 1.1 Supply, Demand, and Equilibrium • Linear Supply Equations – changes in the ‘d’ variable • The ‘d’ variable in the supply equation is an indicator of the responsiveness of producers to price changes. • If something causes producers to be moreresponsive to price changes, the ‘d’ variable will increase • If something causes producers to be less responsive to price changes, the ‘d’ variable will decrease • Assume a new oven technology is developed that allows bakers to more quickly and efficiently increase their production of bread to satisfy rising demand for consumers. The ‘d’ variable in the supply equation increases as a result. The new equation is. • Now, for every $1 increase in price, producers will supply 200 fewer loaves, instead of 150. The Q-intercept will remain the same (-200) but the supply curve will be flatter, indicating producers are more responsive to price changes
Linear Supply Equations • 1.1 Supply, Demand, and Equilibrium Linear Supply Equations – changes in the ‘d’ variable The ‘d’ variable has increased. The new demand curve should reflect this change • Notice the following: • Producers are more responsive to price changes now • As the price rises from $0 to $4 per loaf, now producers will supply 600 loaves, whereas in the original graph they would have only supplied 400 loaves. • Supply for bread has increased because there are fewer substitutes in this village. • The new P-intercept at a lower price. It can be calculated by setting the Q to zero. • 0 • Now, at a price of $1, firms will begin selling bread, whereas before the new oven technology, a price of $1.33 was required
1.1 Supply, Demand, and Equilibrium Linear Supply Equations Video Lesson LINEAR SUPPLY EQUATIONS
1.1 Supply, Demand, and Equilibrium Demand and Supply Equations Video Lesson DERIVING DEMAND AND SUPPLY EQUATIONS FROM A SET OF DATA
1.1 Supply, Demand, and Equilibrium Market Equilibrium • Market Equilibrium • We have now examined several concepts fundamental in understanding how markets work, including: • Demand, the law of demand, and linear demand equations • Supply, the law of supply and linear supply equations • The next step is to put supply and demand together to get… • Market Equilibrium: A market is in equilibrium when the price and quantity are at a level at which supply equals demand. The quantity that consumers demand is exactly equal to the quantity that producers supply. • In equilibrium, a market creates no shortages or surpluses, rather, the market “clears”. Every unit of output that is produced is also consumed. • Equilibrium Price (Pe): The price of a good at which the quantity supplied is equal to the quantity demanded • Equilibrium Quantity (Qe) : The quantity of output in at which supply equals demand.
1.1 Supply, Demand, and Equilibrium Market Equilibrium Price Market Equilibrium Consider the market for bread below. Market for Bread S • Consider the following: • If the price were anything greater than Pe, firms would wish to supply more bread, but consumers would demand less. The market would be out of equilibrium. • If the price were anything less that Pe, consumers would demand more but firms would make less. The market would be out of equilibrium. • Only at Pe does the quantity supplied equal the quantity demanded. This is the equilibrium point in the market for bread. Equilibrium Pe D Quantity Qe
1.1 Supply, Demand, and Equilibrium Market Equilibrium Price Market Equilibrium and Disequilibrium What if the price were NOT Pe in the market below? Market for Bread S • At a price of $3 • Firms will make 12 loaves of bread • Consumers will demand 8 loaves • There will be a surplus of 4 loaves • The price must fall to eliminate this surplus! • At a price of $1 • Firms will make 8 loaves of bread • Consumers will demand 12 loaves • There will be a shortage of 4 loaves • The price must rise to eliminate this shortage! • Only at Pe does this market clear, at any other price the market is in disequilibrium! $3 Equilibrium Pe=$2 $1 D 8 10 12 Quantity
1.1 Supply, Demand, and Equilibrium Efficiency • Market Equilibrium and Efficiency • When a market is in equilibrium, resources are efficiently allocated. To understand what is meant by this, we must think about demand and supply in a new way. • Demand = Marginal Social Benefit (MSB):The demand for any good represents the benefits that society derives from the consumption of that good. Marginal benefits decrease at higher levels of output because additional units of a good bring benefits to fewer and fewer people the more of the good exists. • Supply = Marginal Social Cost (MSC): The supply of a good represents the cost to society of producing the good. For almost all goods, the greater the amount is produced, the more it costs to additional units of it. Think of oil. As the world produces more and more oil, it becomes increasingly harder to produce, thus the marginal cost (the cost for each additional barrel) continuously rises. • Only when the MSB = MSC is society producing the right amount of any good. If output occurs at any other level, we must say that resources are misallocated towards the good.
1.1 Supply, Demand, and Equilibrium Efficiency Price Market Equilibrium and Efficiency Once again, consider the market for bread below. Market for Bread S=MSC • At an output of 8 loaves: • The value society places on the 8th loaf of bread is $3, yet the cost to produce the 8th loaf was only $1. • MSB>MSC, resources are under-allocated towards bread and more should be produced. • At an output of 12 loaves: • The cost of producing the 12th loaf was $3, yet the value society places on the 12th loaf is only $1. • MSC>MSB, resources are over-allocated towards bread and less should be produced. • Only at 10 loaves do the consumers of bread place the same value on it as was imposed on the producers of bread. This is the allocatively efficient level of output! $3 Equilibrium Pe=$2 $1 D=MSB Quantity 8 10 12
1.1 Supply, Demand, and Equilibrium Efficiency Market Equilibrium and Efficiency Allocative efficiency is achieved in a market when the quantity is produced at which the benefit society derives from the last unit is equal to the cost imposed on society to produce the last unit. Allocative efficiency is achieved when Marginal Social Benefit = Marginal Social Cost Assuming there are no “hidden” costs or benefits from the production or consumption of a good, a free market will achieve allocative efficiency when the equilibrium price and quantity prevail.
Efficiency Video Lessons • 1.1 Supply, Demand, and Equilibrium EFFICIENCY AND EQUILIBRIUM IN COMPETITIVE MARKETS
Consumer and Producer Surplus • 1.1 Supply, Demand, and Equilibrium Price $5 Market Equilibrium – Consumer and Producer Surplus Graphically, we can identify the areas representing consumer and producer surplus, which together represent total societal welfare, as following areas. Market for Bread S Consumer Surplus: The area on the market graph below the demand curve and above the equilibrium price. Producer Surplus: The area above the supply curve and below the equilibrium price. Total welfare: The sum of the two areas $22.5 represents the total welfare of producers and consumer s in the bread market. At any price other than $2, welfare would be less than $22.5 Consumer Surplus Equilibrium $2 Producer Surplus D $.5 Quantity 10