Experimental Probability Vs. Theoretical Probability
Experimental Probability Vs. Theoretical Probability. Lesson 6. What do you know about probability?. Probability is a number from 0 to 1 that tells you how likely something is to happen. Probability can have two approaches -experimental probability -theoretical probability.

Experimental Probability Vs. Theoretical Probability
E N D
Presentation Transcript
Experimental Probability Vs. Theoretical Probability Lesson 6
What do you know about probability? • Probability is a number from 0 to 1 that tells you how likely something is to happen. • Probability can have two approaches -experimental probability -theoretical probability
Experimental vs.Theoretical Experimental probability: P(event) = number of times event occurs total number of trials Theoretical probability: P(E) = number of favorable outcomes total number of possible outcomes
Experimental: You tossed a coin 10 times and recorded a head 3 times, a tail 7 times P(head)= 3/10 P(tail) = 7/10 Theoretical: Toss a coin and getting a head or a tail is 1/2. P(head) = 1/2 P(tail) = 1/2 How can you tell which is experimental and which is theoretical probability?
Experimental probability Experimental probability is found by repeating an experiment and observing the outcomes. P(head)= 3/10 A head shows up 3 times out of 10 trials, P(tail) = 7/10 A tail shows up 7 times out of 10 trials
Theoretical probability P(head) = 1/2 P(tail) = 1/2 Since there are only two outcomes, you have 50/50 chance to get a head or a tail. HEADS TAILS
Compare experimental and theoretical probability Both probabilities are ratios that compare the number of favorable outcomes to the total number of possible outcomes P(head)= 3/10 P(tail) = 7/10 P(head) = 1/2 P(tail) = 1/2
A bag contains three red marbles and three blue marbles. P(red) = 3/6 =1/2 Theoretical (The result is based on the possible outcomes) Identifying the Type of Probability
You draw a marble out of the bag, record the color, and replace the marble. After 6 draws, you record 2 red marbles P(red)= 2/6 = 1/3 Experimental (The result is found by repeating an experiment.) Identifying the Type of Probability
How come I never get a theoretical value in both experiments? Tom asked. • If you repeat the experiment many times, the results will getting closer to the theoretical value. • Law of the Large Numbers
Law of the Large Numbers 101 • The Law of Large Numbers was first published in 1713 by Jocob Bernoulli. • It is a fundamental concept for probability and statistic. • This Law states that as the number of trials increase, the experimental probability will get closer and closer to the theoretical probability. http://en.wikipedia.org/wiki/Law_of_large_numbers
Experimental probability is the result of an experiment. Theoretical probability is what is expected to happen. Contrast experimental and theoretical probability
Contrast Experimental and theoretical probability Three students tossed a coin 50 times individually. • Lisa had a head 20 times. ( 20/50 = 0.4) • Tom had a head 26 times. ( 26/50 = 0.52) • Al had a head 28 times. (28/50 = 0.56) • Please compare their results with the theoretical probability. • It should be 25 heads. (25/50 = 0.5)
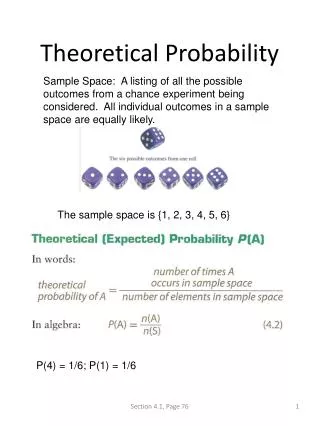
Probabilityis the measure of how likely an event is to occur. Each possible result of a probability experiment or situation is an outcome. The sample spaceis the set of all possible outcomes. An eventis an outcome or set of outcomes.
Probabilities are written as fractions or decimals from 0 to 1, or as percents from 0% to 100%.
Equally likely outcomeshave the same chance of occurring. When you toss a fair coin, heads and tails are equally likely outcomes. Favorable outcomesare outcomes in a specified event. For equally likely outcomes, the theoretical probabilityof an event is the ratio of the number of favorable outcomes to the total number of outcomes.
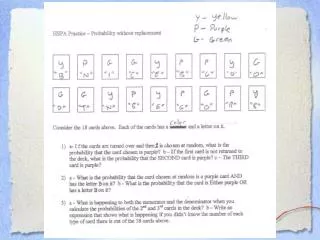
Example 1A: Finding Theoretical Probability Each letter of the word PROBABLE is written on a separate card. The cards are placed face down and mixed up. What is the probability that a randomly selected card has a consonant? There are 8 possible outcomes and 5 favorable outcomes.
Example 1B: Finding Theoretical Probability Two number cubes are rolled. What is the probability that the difference between the two numbers is 4? There are 36 possible outcomes. 4 outcomes with a difference of 4: (1, 5), (2, 6), (5, 1), and (6, 2)
Check It Out! Example 1a A red number cube and a blue number cube are rolled. If all numbers are equally likely, what is the probability of the event? The sum is 6.
Check It Out! Example 1b A red number cube and a blue number cube are rolled. If all numbers are equally likely, what is the probability of the event? The difference is 6.
Check It Out! Example 1c A red number cube and a blue number cube are rolled. If all numbers are equally likely, what is the probability of the event? The red cube is greater.
The sum of all probabilities in the sample space is 1. The complementof an event E is the set of all outcomes in the sample space that are not in E.
Example 2: Application There are 25 students in study hall. The table shows the number of students who are studying a foreign language. What is the probability that a randomly selected student is not studying a foreign language?
, or 16% Example 2 Continued Use the complement. P(not foreign) = 1 – P(foreign) There are 21 students studying a foreign language. There is a 16% chance that the selected student is not studying a foreign language.
Check It Out! Example 2 Two integers from 1 to 10 are randomly selected. The same number may be chosen twice. What is the probability that both numbers are less than 9?
Example 3: Finding Probability with Permutations or Combinations Each student receives a 5-digit locker combination. What is the probability of receiving a combination with all odd digits? Step 1 Determine whether the code is a permutation or a combination. Order is important, so it is a permutation.
Example 3 Continued Step 2 Find the number of outcomes in the sample space. number number number number number 10 10 10 10 10 = 100,000 There are 100,000 outcomes.
Example 3 Continued Step 3 Find the number of favorable outcomes. odd odd odd odd odd 5 5 5 5 5 = 3125 There are 3125 favorable outcomes.
The probability that a combination would have only odd digits is Example 3 Continued Step 4 Find the probability.
Check It Out! Example 3 A DJ randomly selects 2 of 8 ads to play before her show. Two of the ads are by a local retailer. What is the probability that she will play both of the retailer’s ads before her show?
Geometric probabilityis a form of theoretical probability determined by a ratio of lengths, areas, or volumes.
Example 4: Finding Geometric Probability A figure is created placing a rectangle inside a triangle inside a square as shown. If a point inside the figure is chosen at random, what is the probability that the point is inside the shaded region?
Find the ratio of the area of the shaded region to the area of the entire square. The area of a square is s2, the area of a triangle is , and the area of a rectangle is lw. Example 4 Continued First, find the area of the entire square. At = (9)2 = 81 Total area of the square.
Example 4 Continued Next, find the area of the triangle. Area of the triangle. Next, find the area of the rectangle. Arectangle = (3)(4) = 12 Area of the rectangle. Subtract to find the shaded area. As = 40.5 – 12 = 28.5 Area of the shaded region. Ratio of the shaded region to total area.
Check It Out! Example 4 Find the probability that a point chosen at random inside the large triangle is in the small triangle.
You can estimate the probability of an event by using data, or by experiment. For example, if a doctor states that an operation “has an 80% probability of success,” 80% is an estimate of probability based on similar case histories. Each repetition of an experiment is a trial. The sample space of an experiment is the set of all possible outcomes. The experimental probabilityof an event is the ratio of the number of times that the event occurs, the frequency, to the number of trials.
Experimental probability is often used to estimate theoretical probability and to make predictions.
Example 5A: Finding Experimental Probability The table shows the results of a spinner experiment. Find the experimental probability. spinning a 4 The outcome of 4 occurred 14 times out of 50 trials.
Example 5B: Finding Experimental Probability The table shows the results of a spinner experiment. Find the experimental probability. spinning a number greater than 2 The numbers 3 and 4 are greater than 2. 3 occurred 19 times and 4 occurred 14 times.
Check It Out! Example 5a The table shows the results of choosing one card from a deck of cards, recording the suit, and then replacing the card. Find the experimental probability of choosing a diamond.
Check It Out! Example 5b The table shows the results of choosing one card from a deck of cards, recording the suit, and then replacing the card. Find the experimental probability of choosing a card that is not a club.