Download
1 / 15
150 likes | 275 Views
Aim: What is the difference between an association between variables and causation?. HW#9: read Chapter 2.6 pages 154-157 On page 159 #2.122, page 160#2.124, 2.126. The Question of Causation.

E N D
Aim: What is the difference between an association between variables and causation? HW#9: read Chapter 2.6 pages 154-157 On page 159 #2.122, page 160#2.124, 2.126
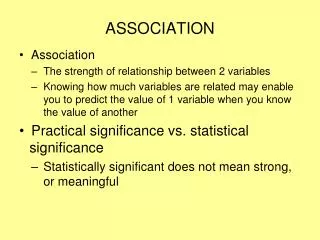
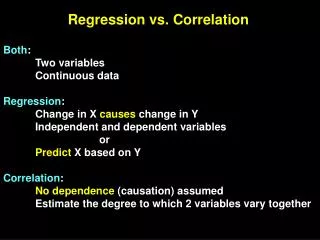
The Question of Causation • When looking at the relationship between two variables, the goal is to establish that changes in the explanatory variable (independent variable) CAUSES changes in the response variable (dependent variable) • Even when a strong association is present, the conclusion that this association is due to a causal link between the variables is often hard to find.
Examples of observed associations • Mother’s body mass index and daughter's body mass index • Amount of artificial sweetener saccharin in a rat’s diet and count of tumors in the rat’s bladder • A student’s SAT scores as a high school senior and a student’s first-year college grade point average • Monthly flow of money into stock mutual funds and monthly rate of return for the stock market
Examples of direct causation • Mother’s body mass index and daughter's body mass index • Amount of artificial sweetener saccharin in a rat’s diet and count of tumors in the rat’s bladder The only ones with also have direct causation
Explaining association: CAUSATION • A study of Mexican American girls aged 9 to 12 years recorded body mass index (BMI), a measure of weight relative to height, for both the girls and their mothers. People with high BMI are overweight or obese. The study also measured hours of television, minutes of physical activity, and intake of several kinds of food. The strongest correlation (r = 0.506) was between the BMI of daughters and the BMI of their mothers. • Body type is in part determined by heredity. Daughters inherit half their genes from their mothers. There is therefore a direct causal link between the BMI of mothers and daughters. Yet the mothers' BMIs explain only 25.6% (that's r2 again) of the variation among the daughters' BMIs. Other factors, such as diet and exercise, also influence BMI. • Even when direct causation is present, it is rarely a complete explanation of an association between two variables.
Best evidence of causation • Comes from experiments that actually change x while holding all other factors fixed; therefore if y changes, there is a good reason to think that x caused the change in y • Example: Experiments show that large amounts of saccharin—about 5% of the entire diet—cause bladder tumors in rats. Should we avoid saccharin as a replacement for sugar in food? Rats are not people. Although we can't experiment with people, studies of people who consume different amounts of saccharin fail to find an association between saccharin and bladder tumors. • Even well-established causal relations may not generalize to other settings.
Explaining Association: COMMON RESPONSE • The observed association between x and y is explained by a lurking variable z • Both x and y change in response to changes in z • This common response creates an association even though there may be no direct causal link between x and y
Example of Common Response • A student’s SAT scores as a high school senior and a student’s first-year college grade point average • Monthly flow of money into stock mutual funds and monthly rate of return for the stock market Examples of how common response can create an association
Explaining Association: COMMON RESPONSE • Example 1: SAT scores and college grades. Students who are smart and who have learned a lot tend to have both high SAT scores and high college grades. The positive correlation is explained by this common response to students' ability and knowledge. • Example 2: Stock market performance and investments in mutual funds. There is a strong positive correlation between how much money individuals add to mutual funds each month and how well the stock market does the same month. Is the new money driving the market up? The correlation may be explained in part by common response to underlying investor sentiment: when optimism reigns, individuals send money to funds and large institutions also invest more. The institutions would drive up prices even if individuals did nothing. In addition, what causation there is may operate in the other direction: when the market is doing well, individuals rush to add money to their mutual funds.
Explaining Association: Confounding • Two variables are confounding when their effects on a response variable cannot be distinguished from each other. • The confounding variable may be either explanatory variables or lurking variables. • When many variables interact with each other, confounding of several variables often prevent us from drawing conclusions about causation • Because x is confounded with z, we cannot distinguish the influence of x from the influence of z • We cannot say how strong the direct effect of x on y is; it can be hard to say if x influences y at all
Examples of Confounding • Whether a person regularly attends religious services and how long the person lives • The number of years of education a worker has and the worker’s income • Associations are explained in part by confounding
Explaining Association: Confounding • Example 1: Religion and a long life. Many studies have found that people who are active in their religion live longer than nonreligious people. But people who attend church or mosque or synagogue also take better care of themselves than nonattenders. They are less likely to smoke, more likely to exercise, and less likely to be overweight. The effects of these good habits are confounded with the direct effects of attending religious services. • Example 2: Education and income. It is likely that more education is a cause of higher income—many highly paid professions require advanced education. However, confounding is also present. People who have high ability and come from prosperous homes are more likely to get many years of education than people who are less able or poorer. Of course, people who start out able and rich are more likely to have high earnings even without much education. We can't say how much of the higher income of well-educated people is actually caused by their education.
Confounding and Common Response • Both common response and confounding involve the influences of a lurking variable (or variables) z on the response variable y • The distribution between these two types of relationships is less important than the common element, the influence of lurking variables *EVEN A VERY STRONG ASSOCIATION BETWEEN TWO VAIRABLES IS NOT BY ITSELF GOOD EVIDENCE THAT THERE IS A CAUSE-AND-EFFECT LINK BETWEEN THE VARIABLES*
Homework: • Online courses. Many colleges offer online versions of some courses that are also taught in the classroom. It often happens that the students who enroll in the online version do better than the classroom students on the course exams. This does not show that online instruction is more effective than classroom teaching, because the kind of people who sign up for online courses are often quite different from the classroom students. Suggest some student characteristics that you think could be confounded with online versus classroom. Use a diagram like Figure 2.28(c) (page 154) to illustrate your ideas.