Download
1 / 43
450 likes | 741 Views
Logic of Causation. Cause and effect Determinism vs. free will Explanation:. Why?. Bi variate relationship (2 variables). Causality. X. Y. (Cause) Independent variable. (Effect) Dependent variable. Multi variate relationship (3+ variables). Causality. X. Y. Z. (Causes)

E N D
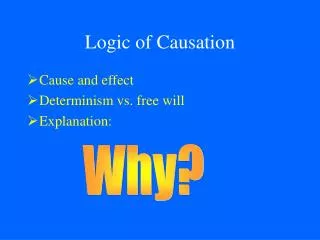
Logic of Causation • Cause and effect • Determinism vs. free will • Explanation: Why?
Bivariate relationship (2 variables) Causality X Y (Cause) Independent variable (Effect) Dependent variable
Multivariate relationship (3+ variables) Causality X Y Z (Causes) Independent variables (Effect) Dependent variable
Types of causes (n=2) • Necessary cause: X must happen for Y to happen “Need X to get Y” • Sufficient cause: Y always happens when X happens “Always get Y when you have X”
Criteria for Causality (n=3) • Cause must precede effect: X Y
2) The two variables must be empirically associated Criteria for Causality X Y
Observed association cannot be explained away by a third variable (test for spuriousness) X = # firefighters Y = amt. of damage Criteria for Causality
Criteria for Causality Y + X Y X= # firefighters Y= amt. of damage X
Spurious relationship? + # babies # storks
Elaboration Paradigm • Purpose: to understand nature of observed relationships • Test: for spuriousness • Move: from bivariate table to trivariate table • Evaluate for possible outcomes: replication, explanation, interpretation, specification
Explanation: X Z Y
Interpretation: X Z Y
Rules for creating tables • Percentage down (in the direction of causality) • Dependent variable on the side • Independent variable(s) on the top • Compare across • Watch for small Ns in columns • Collapse on theoretical grounds
Elaboration Paradigm Succinct table reduces redundancy
Elaboration Paradigm Make it succinct!
Elaboration Paradigm What happens to the original relationship within categories of the test variable?
Elaboration Paradigm Source: Eleanor Maccoby 1960 data (reprinted in Travis Hirschi and Hanan Selvin, 1967, Delinquency Research: An Appraisal of Analytic Methods, New York: Free Press, p. 240)
Elaboration Paradigm Source: Eleanor Maccoby 1960 data (reprinted in Travis Hirschi and Hanan Selvin, 1967, Delinquency Research: An Appraisal of Analytic Methods, New York: Free Press, p. 240)
Elaboration Paradigm Source: Eleanor Maccoby 1960 data (reprinted in Travis Hirschi and Hanan Selvin, 1967, Delinquency Research: An Appraisal of Analytic Methods, New York: Free Press, p. 240)
Elaboration Paradigm Source: Eleanor Maccoby 1960 data (reprinted in Travis Hirschi and Hanan Selvin, 1967, Delinquency Research: An Appraisal of Analytic Methods, New York: Free Press, p. 240)
Testing hypotheses Hypothesis: “Men are more accident prone than women” X = ? Y = ?
Elaboration Paradigm:using GSS Hypothesis: Women were more likely than men to vote for Bill Clinton in 1996
Elaboration paradigm X = ? Y = ? Z = ?
Elaboration Paradigm Review rules: • Percentage down (in direction of causality) • Compare across • Check N in columns
Original relationship Source: General Social Survey, 1998
Original relationship Rules for interpretation: • General statement about relationship (modeled on the hypothesis) • Compare specific percentages • GEE! (generalization, example, exception)(Miller, 2005)
Trivariate table Source: General Social Survey 1998
Trivariate table Source: General Social Survey 1998
Interpreting trivariate tables Trivariate mantra: What happens to the original relationship within categories of the test variable?
Refinements to elaboration paradigm:suppressor and distorter variables • Suppressor variable (relationship emerges): bivariate = no relationship trivariate = positive or negative relationship • Distorter variable (relationship switches): bivariate = positive relationship trivariate = negative relationship (or negative to positive)
3 dimensional tables: basic table General Social Survey, 1977-78
3-D table:statistical interaction General Social Survey, 1977-78 Note: *=Chi square for religion, p=<.05
3-D table:statistical interaction General Social Survey, 2000-04 Note: Chi square (no p values for religion less than .05)
Statistical interaction Question to ask: “Does the effect of one variable (X) on another (Y) remain the same for all groups of the third (Z) variable?”