Download
1 / 13
130 likes | 298 Views
Box-and-whisker Plots. Learn to find measures of variability. The range of a data set is the largest value minus the smallest value. The table below summarizes a veterinarian’s records for kitten litters born in a given year.

E N D
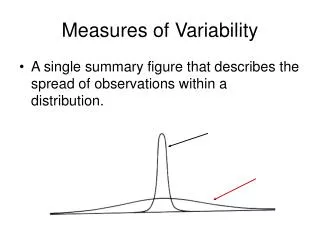
Box-and-whisker Plots Learn to find measures of variability.
The range of a data set is the largest value minus the smallest value. The table below summarizes a veterinarian’s records for kitten litters born in a given year. While central tendency describes the middle of a data set, variability describes how spread out the data is. Quartiles divide a data set into four equal parts.
Third quartile: 5 median of upper half First quartile: 3 median of lower half Median: 4 (second quartile) The range of a data set is the largest value minus the smallest value. For the kitten data, the range is 6 — 2 = 4. Kitten Data Lower half Upper half 2 3 3 3 3 3 3 4 4 4 4 4 4 4 4 5 5 5 5 5 5 5 5 5 5 5 6 The range is affected by outliers, so another measure is often used. Quartiles divide a data set into four equal parts.
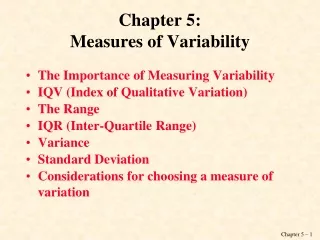
1 2 3 4 5 6 7 8 9 A box-and-whiskerplot shows the distribution of data. The middle half of the data is represented by a “box” with a vertical line at the median. The lower fourth and upper fourth quarters are represented by “whiskers” that extend to the smallest and largest values. Median First quartile Third quartile
31 + 33 2 24 + 26 2 third quartile: = 32 first quartile: = 25 29 + 31 2 median: = 30 Try This: Use the given data to make a box-and-whisker plot. 31, 23, 33, 35, 26, 24, 31, 29 Step 1. Order the data and find the smallest value, first quartile, median, third quartile, and largest value. 23 24 26 29 31 31 33 35 smallest value: 23 largest value: 35
22 24 26 28 30 32 34 36 38 Use the given data to make a box-and-whisker plot. Step 2. Draw a number line and plot a point above each value. 23 24 26 29 31 31 33 35
22 24 26 28 30 32 34 36 38 Use the given data to make a box-and-whisker plot. Step 3. Draw the box and whiskers. Step 2. Draw a number line and plot a point above each value. 23 24 26 29 31 31 33 35
Finding Measures of Variability Find the range and the first and third quartiles for the data set. A. 15, 83, 75, 12, 19, 74, 21 Order the values. 12 15 19 21 74 75 83 range: 83 – 12 = 71 first quartile: 15 third quartile: 75
63 + 75 2 first quartile: = 69 79 + 88 2 third quartile: = 83.5 Finding Measures of Variability Find the range and the first and third quartiles for the data set. B. 75, 61, 88, 79, 79, 99, 63, 77 Order the values. 61 63 75 77 79 79 88 99 range: 99 – 61 = 38
15 + 17 2 21 + 21 2 third quartile: = 21 first quartile: = 16 19 + 19 2 median: = 19 Making a Box-and-Whisker Plot Use the given data to make a box-and-whisker plot: 21, 25, 15, 13, 17, 19, 19, 21 Step 1. Order the data and find the smallest value, first quartile, median, third quartile, and largest value. 13 15 17 19 19 21 21 25 smallest value: 13 largest value: 25
12 14 16 18 20 22 24 26 28 Continued: Use the given data to make a box-and-whisker plot. Step 2. Draw a number line and plot a point above each value from step 1. Step 1. Order the data and find the smallest value, first quartile, median, third quartile, and largest value. 13 15 17 19 19 21 21 25 smallest value 13 first quartile 16 third quartile 21 largest value 25 median 19
12 14 16 18 20 22 24 26 28 Continued: Use the given data to make a box-and-whisker plot. Step 3. Draw the box and whiskers. Step 2. Draw a number line and plot a point above each value. 13 15 17 19 19 21 21 25
78 87 91 94 98 Lesson Quiz Use the following data for problems 3 and 4. 91, 87, 98, 93, 89, 78, 94 1. Make a box-and-whisker plot 2. What are the 3 quartiles? 87, 91, 94