Download

1 / 17
170 likes | 329 Views
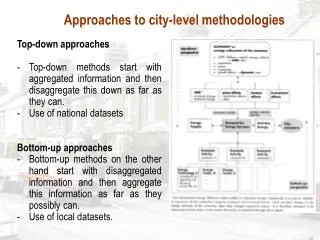
This paper explores advanced methods for estimating congestion during the top-down placement phase in VLSI design. It discusses the motivations for accurate congestion estimation, including the impact on routability and timing. Key topics include peak congestion prediction, regional congestion estimation, and experimental results demonstrating the effectiveness of these methods. The use of Rent's rule for wirelength estimation is emphasized, showcasing its importance in minimizing routing congestion and improving design efficiency.

E N D
Congestion Estimation During Top-Down Placement Xiaojian Yang Ryan Kastner Majid Sarrafzadeh Embedded and Reconfigurable System Lab Computer Science Department, UCLA 1
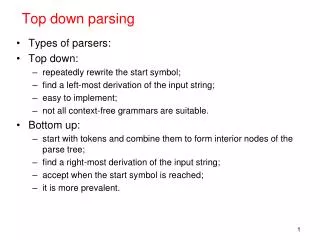
Outline • Introduction • Motivation • Peak Congestion Prediction • Regional Congestion Estimation • Experimental Results • Conclusion 2
Introduction • Place & Route Objectives: • Routability and Timing • Placement • Minimizing Bounding Box Wirelength • Shorter Bounding Box Better Routability • Congestion • Routability problem • Detours --- Timing problem 3
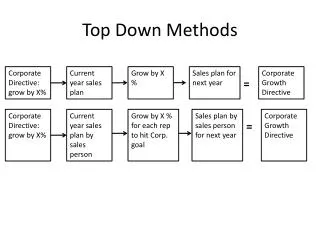
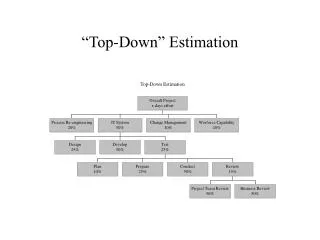
Motivation of Congestion Est. • Early stages of Top-down Placement • Logic design • Congestion Relieving in Top-down Placement 4
Motivation of Congestion Est. • Congestion Relieving based on estimation • White space re-allocation • Moving cells out of congested area 5
Basis of Estimation P = T • B r Rent’s Rule P - Number of external terminals B – Number of cells T – Rent coefficient r – Rent exponent 6
Peak Congestion Estimation --- Worst Case C1 C3 C2 C1 C2 H: # levels 7
Regional Congestion Est. Internal routing demand External routing demand Uniformly distributed routing supply 11
Internal Routing Estimation • Wirelength Estimation based on Rent’s rule • P = TB • Rent exponent r • Locality of Rent’s rule • Different subcircuits have different Rent Exponents • Rent Exponent Extraction • Dynamic extraction using partitioning tool • Linear regression on data points • Wirelength Estimation Model • Donath’s (1979) and Davis’s (1998) r 12
External Routing Estimation 0.5 0.25 0.5 0.25 0.5 0.25 1.0 Routing demand caused by inter-block connection Probability-matrix within the Bounding box 13
Regional Congestion Est. External Routing demand (routing estimation) + Internal Routing demand (wirelength estimation) = Routing demand (congestion) Of a region 14
Region Congestion Est. Experiments Congestion Estimator Maze Router Compare after Normalization C1 C2 C1’ C2’ C3 C4 C3’ C4’ Top-down Placement 64 x 64 or 128 x 128 15
Estimation Result • 8 benchmarks, 12k cells --- 147k cells • 2 x 2 regions • Wirelength Estimation only 9% • Including External Routing demand 8% • 4 x 4 regions • Wirelength Estimation only 13% • Including External Routing demand 9% • Running time • Partitioning speed • 147k cells, 2 x 2, 860 seconds, Sun Ultra-10 • Place / Route 8000 seconds 16
Conclusion & Future Work • Possibility to estimate congestion by Rent’s rule • Congestion can be estimated during Top-down placement • Peak congestion after L-shape routing can be accurately estimated • Regional congestion estimation is within 10% comparing with actual congestion by place/route • Future work • More accurate model for “hot spot” estimation • Fast estimation by Rent parameter prediction 17