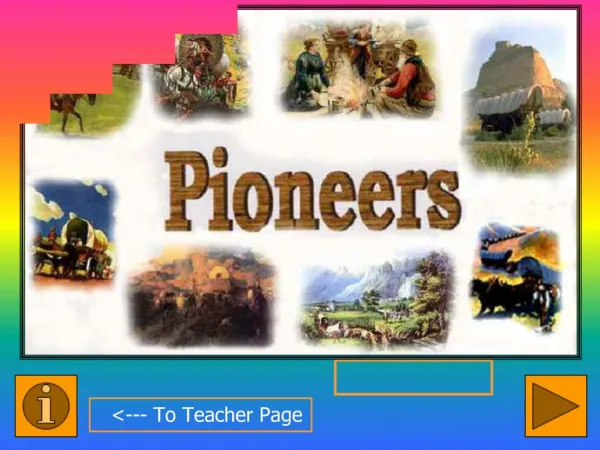
Download
1 / 57
570 likes | 589 Views
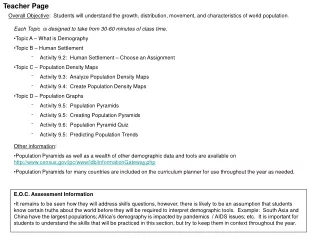
Teacher Page. Overall Objective : Students will understand the growth, distribution, movement, and characteristics of world population. Each Topic is designed to take from 30-60 minutes of class time . Topic A – What is Demography Topic B – Human Settlement

E N D
Teacher Page Overall Objective: Students will understand the growth, distribution, movement, and characteristics of world population. • Each Topic is designed to take from 30-60 minutes of class time. • Topic A – What is Demography • Topic B – Human Settlement • Activity 9.2: Human Settlement – Choose an Assignment • Topic C – Population Density Maps • Activity 9.3: Analyze Population Density Maps • Activity 9.4: Create Population Density Maps • Topic D – Population Graphs • Activity 9.5: Population Pyramids • Activity 9.5: Creating Population Pyramids • Activity 9.6: Population Pyramid Quiz • Activity 9.5: Predicting Population Trends • Other information: • Population Pyramids as well as a wealth of other demographic data and tools are available on http://www.census.gov/ipc/www/idb/informationGateway.php • Population Pyramids for many countries are included on the curriculum planner for use throughout the year as needed. • E.O.C. Assessment Information • It remains to be seen how they will address skills questions, however, there is likely to be an assumption that students know certain truths about the world before they will be required to interpret demographic tools. Example: South Asia and China have the largest populations; Africa’s demography is impacted by pandemics / AIDS issues; etc. It is important for students to understand the skills that will be practiced in this section, but try to keep them in context throughout the year.
DEMOGRAPHY Jarrett Book: Chapter 10 159 – 174
Essential Questions What factors influence where people settle? Is the world’s population growing too fast?
Important Ideas • Size and Distribution of Human Settlement • Changes in Settlement Patterns • Population Density Maps • Population Pyramids • World Population Growth
Demography • Complicated Topic? • What is Demography? • What is the difference between “demographics” and demography”? • There are some interesting tools that demographers sometimes use: • Population Density Maps • Population Pyramids and Graphs
FOUR KEY TERMS FOR DEMOGRAPHERS Life Expectancy Birth Rate How fast are new babies being born into a population? How long are people expected to live? Literacy Rate Per Capita Income What percentage of people can read? How much money does the average person make?
WHY ARE THESE TOPICS IMPORTANT IN DEMOGRAPHY? Life Expectancy Birthrate If people live long then the population is larger. Also, elderly people often have greater needs. The more babies that are being born, the faster the population is likely to grow Literacy Rate Per Capita Income Usually, societies with higher literacy rates have slower population growth. With more income, people can afford more healthcare, and better food and medicine which helps people live longer.
1. First draw a conclusion 2. Then, decide why the conclusion matters
Life is Good Death is Bad 2 2 4 4 THE WINNER? 1 1 3 3 First draw a conclusion then think about why it would be important . . . • Which of these countries is most likely to need more doctors or more training for medical professionals? • Which of these countries has the best health care system?
First Human Settlement • Before people figured out they could grow their food with seeds, people were nomadic. What does that mean? • What allowed people to finally settle in one place? • Come on, use the big, scary vocabulary word!
BIRTH OF URBAN POPULATIONS • Quick Review, what is another word for “urban”? Is this statement true or false: “There is no real reason why large cities form where they do, it just happens.”
ANCIENT CIVILIZATIONS Get ready for a little quiz. You need to be writing down important information off of the next slide. I am not going to give you the answers to the questions, but you will have to use the information to get the right answers. Listen closely as we talk about this, you will need the information! Map used with permission for educational purposes in this instance only from http://www.worldatlas.com/aatlas/woutline.htm
Huang He River Tigris River Euphrates River Huang He Valley Indus River Mesopotamia Indus Valley The Nile Valley Nile River Map used with permission for educational purposes in this instance only from http://www.worldatlas.com/aatlas/woutline.htm
ANCIENT CIVILIZATIONS QUIZ 1. What is the major similarity between all of the early urban civilizations? 2. What did the people of these regions feel about annual flooding? 3. Why was the discovery of agriculture so important to the formation of large urban areas? 4. Which continent was home to the most early larger urban centers? 5. Write a VERY SHORT paragraph (3 sentences) that explains why the following statement is true: “Early urban populations formed near major rivers.” Map used with permission for educational purposes in this instance only from http://www.worldatlas.com/aatlas/woutline.htm
Draw a circle in your notes. In the middle write this word: “Urbanization” Factory Jobs Failure of Farms Industrial Revolution In the circle either write or draw some images that explain why people would leave rural areas to go to urban areas? Industrialization And Urbanization Centers of Trade New Inventions Disease
Factors Influencing Where People Settle • Just as there are a lot of reasons why cities grow, there are a lot of reason why their population might decrease. Can you think of any reasons? • There are also some basic reasons why people settle where they do or why they might move to a new location. These are usually some of the same reasons.
A B C D E F Let’s play a game!!! Economic Reasons Technology Natural Resources Factors that influencing where people settle? Access to Transportation Bodies of Water Geographic Barriers / Dangers
Where are the brightest lights? Image – Public Domain
Cultural Regions Challenge Question: How do bodies of water still impact settlement today? • THIS IS IMPORTANT TO UNDERSTAND!!! • The first civilizations formed near major rivers. • As urban populations develop, the need for systems increases. (Example: Government, etc.) • The industrial revolution increased the speed of urbanization. • Towns and cities grow up around factories and other economic activities.
Population Density Maps User Roke releases this image under the Creative Commons Attribution-Share Alike 3.0 Unported license
DOT MAPS The map key or legend is very important for this type of map Just because there is no dot, it does not mean there are no people there. = 100 people Lets use this imaginary island of “Larry” to try to explain. Larry is a tiny island in the Pacific Ocean with a very small population.
So on this map of the Island of Larry, each dot represents 100 people. = So this, is just easier to look at than something like this:
Only five families live in this small town, so it gets no dot.
DOT MAPS • Sometimes just understanding a little more about the area you are talking about helps you understand why the dots are the way they are. • So, if it is not exact, what is the purpose of a dot map? What kinds of things can you determine from a dot map?
Lets give it a try in AUSTRALIA So where do you think all of the people in Australia might live? Why is no on living in the middle? The Australians call non-urban areas in the center of the country “The Outback”. Much of it is very desert-like.
Population Density Maps Much like the dot maps, other types of population density maps have a specific purpose. Think about the way the dots were used.
Population Density Maps This map shows only urban areas that have over 1 million people User Anwar Sadat releases this work is licensed under the Creative Commons Attribution-ShareAlike 3.0 License.
Population Density Maps This map generalizes the population density for each country around the world? Does this tell you more or less than a dot map?
0-1 (white) 1-4 (yellow) 5-9 (yellow-green) 10-24 (green) 25-49 (teal) 50-99 (dark teal) 100-249 (blue) 250-66,995 (dark blue) Here is the same type of map done by county. Maps like this one can help the government make decisions that will impact your life.
Patterns, Size and Distribution of Cities • Cities usually form for economic reasons • Homes are built outside of this central area. These areas for homes are called “residential areas”. • As the city grows other smaller towns / cities are formed around it for various reasons. These are called suburbs. Suburbs Residential Suburbs Suburbs Central Business District (Downtown) Residential Suburbs Residential Suburbs Suburbs
Population Maps Challenge Question: Why is there a need for so many different types of population maps? • THIS IS IMPORTANT TO UNDERSTAND!!! • Population Maps come in different forms • Dots on a population dot map usually only indicate large groups of people rather than just individuals. • Many population maps use preset areas such as countries, states, counties, etc to generalize about population density. • A single urban area may include a downtown area, residential area, and sub-urban area.
Population Pyramids Does this scare you? Of all of a geographer’s tools, these things seem to scare people the most. However, with a few hints, you should be ok with them.
Population Pyramids Hint #1: They almost always talk about three things: A. Number of People B. Age of the People C. Men and Women
Population Pyramids Population in Millions Population in Millions Age Age Hint #2: Its really just two graphs they have put together
Population Pyramids Hint # 3: The reason its called a population pyramid is that the top will always get smaller because people cannot live forever. There are almost never going to be as many 80 year olds as there are 40 year olds.
True or False: Women traditionally live longer than men in the United States.
True or False: The female population is growing much faster than the male population.
True or False: Health issues for Americans are more likely to occur after fifty years old
What can you tell me about this country? • What is the life expectancy in this country? • Tell me about the elderly population? • Describe the birthrate? • So is this a growing (expanding) population, a stable population, or a contracting (decreasing) population
What can you tell me about this country? Male Female • What is the life expectancy in this country? • Tell me about the elderly population? • Describe the birthrate? • So is this a growing (expanding) population, a stable population, or a contracting (decreasing) population
What can you tell me about this country? Male Female • What is the life expectancy in this country? • Tell me about the elderly population? • Describe the birthrate? • So is this a growing (expanding) population, a stable population, or a contracting (decreasing) population
What can you tell me about this country? Male Female See how there are fewer births here? • What is the life expectancy in this country? • Tell me about the elderly population? • Describe the birthrate? • So is this a growing (expanding) population, a stable population, or a contracting (decreasing) population
The Sudan indicates a growing population, but notice the life expectancy. That area of the world has a major problem with political instability and terrorism.
This is Japan, and it is most definitely a decreasing population. They do have a large amount of people from 20 – 30, but the number of children is rapidly decreasing.
Brazil might be slightly approaching a decreasing population. However, at this point since the birthrate is still larger or equal to the other years then it is considered stable.
The Congo in Africa indicates a growing population, but once again, life expectancy is not a positive. The curve here is pretty sharp.