Download

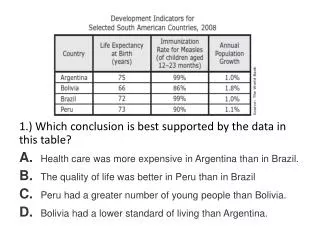
1 / 20
200 likes | 325 Views
Guide to Organizing Data and Writing the Conclusion / Evaluation. Big Idea: D ata tables ORGANIZE the data A good title is descriptive and includes the IV and DV. t he 4 different islands. Big Idea: A graph is a VISUAL REPRESENTATION of the data; it makes it easier to SEE PATTERNS.

E N D
Guide to Organizing Data and Writing the Conclusion/Evaluation
Big Idea: • Data tables ORGANIZE the data • A good title is descriptive and includes the IV and DV
the 4 different islands. • Big Idea: • A graph is a VISUAL REPRESENTATION of the data; it makes it easier to SEE PATTERNS Bar Graph showing average number of nuts collected using different beaks The Relationship Between …….. Amount of food collected (# of pieces or mL for Nectar)
Writing in Science • How is writing in Science class different than writing in English class? • How is writing a conclusion for an investigation like “Survival of the Beakest” different than writing a conclusion for an essay in English?
Examples During class, we have been learning about how fertilizers help plants grow by adding nitrogen to the soil. Plants need nitrogen so they can grow larger and repair themselves more efficiently. Bacteria and other decomposers naturally add nitrogen to the soil by breaking down dead matter from plants and animals. When these are broken down, the nitrogen that was once in them enters the soil, which can then be used by other plants. During this lab, I was trying to determine if MiracleGro Fertilizer helps plants grow bigger. My hypothesis was that it would help plants grow bigger because it is a very well-known fertilizer (and it wouldn’t be so well known if it didn’t work). My data supported my hypothesis. On average, the plants that received MiracleGro grew 2 cm in 13 days. The plants that only received water grew 1.35 cm in 13 days. Therefore, using MiracleGro resulted in bigger plants. One source of error that may have produced incorrect data collected was that the experiment wasn’t run for a long enough period of time. I will use the information I learned from this experiment when I plant a garden this summer. I will be sure to use fertilizer on my garden to help the plants grow larger. I would like to learn more about different types of fertilizers and if certain fertilizers work better than others. Then I could use the best fertilizer on my garden.
Differences • Structure • Hypothesis • Aim • Observations – only what is seen (not creative descriptions) • Look for patterns (use of visuals like graphs) • Conclusion most important: use specific data and numbers to describe results; science behind ideas • Evaluation: source of errors/ fair test (not how you liked it)
Aim: How does beak type affect a bird’s ability to eat a certain type of food? • Conclusion Part 1: Describe results through eyes of scientist. Record observations. Just the facts! Be specific & exact. Use the data (#s)! Look for patterns. • Conclusion Part 2: Explain the “science” behind the results. Summary that explains how mutation, adaptation and natural selection played an important role in the different bird populations’ ability to reproduce and survive. • Evaluation: Explain what could have made the results inaccurate.
Big Idea: • All claims/statements in the conclusion need to be supported by actual evidence (real numbers) from the experiment.
Extension: Read article posted on the blog: How Darwin’s Finches Got their Beaks
BIG IDEA: Evaluation is very important to determine whether the experiment is a FAIR TEST. • There may be several minor errors but overall result remains unchanged. • There may be a single error only but may have greatly affected the final • result.
BIG IDEA: • Going over the • checklist allows you to • check whether you • have missed something • You have time to make • necessary changes
More examples of conclusions Part 1 (aim) and Part 2 (explain science)
Conclusion Part 1 (Aim) In the case of choosing between two routes to the top of a mountain, the work done going straight up (Route A) the mountain and taking the long scenic route around (route B) to the top: • it is difficult to tell whether the work is the same or not from the results given by individual groups; • however, from the combined results, it becomes clearer that both routes take the same amount of work. • For example, our group results had a difference of 0.1 J between Route A and B, with Route A using 2.2 J of work and Route B using 2.3 J of work. However, the class average results only had a difference of 0.02 J between Route A and B, with both routes taking about 2.2 J of work.
Conclusion part 2: Explaining the Science • Work = PE = m x g x h. • In the case of this experiment: • the mass was the same because the same car was used, • Acceleration due to gravity is a constant so it was the same, • and height was also the same- the top of the mountain/ramp did not change. • Therefore, the PE and thus the amount of Work, is the same.