Download
1 / 29
320 likes | 478 Views
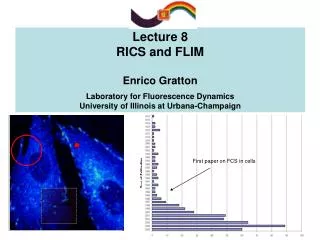
Lecture 4: Fluorescence. UV/Visible and CD are Absorption techniques: The electron absorbs energy from the photon, gets to an excited state . But what happens after that?. The electron can be completely kicked out of it’s orbital (which we can detect as a current – think PMT).

E N D
Lecture 4: Fluorescence UV/Visible and CD are Absorption techniques: The electron absorbs energy from the photon, gets to an excited state. But what happens after that? The electron can be completely kicked out of it’s orbital (which we can detect as a current – think PMT) The electron can lose it’s energy by exciting the vibrational modes of nearby atoms (heat) The electron can lose it’s energy by emitting a photon of lower energy than the original transition. This last option is called Fluorescence, and where it occurs, we can use it to our advantage
h2 h1 Fluorescence:Physical Basis The first step in the fluorescence process is absoprtion. As we know, this occurs as a normal/boltzmann distribution of energies * h Absorption Relaxation: Measured as the Fluorescence Lifetime (~ 1 – 25 ns) Fluorescence: Always at a higher wavelenth, can be anisotropic
Fluorescence: Quantum Yield An important difference between measuring absorption and fluorescence is that the photo-emission pathway must compete with other energy decay pathways This results in an ‘efficiency of Fluorescence’ called the Quantum Yield () All of the decay pathways that contribute to are sensitive to the environment of the fluorophore including: The solvent Temperature Nearby resonant electrons
Fluorescence Lifetime The Quantum Yield can also be expressed as a function of the rates of the competing decay processes ke = rate of radiative decay ki = the rate associated with any non-radiative process The non-radiative pathways are: Collisional quenching (Temperature): Collision excites vibrational state that is resonant with e-* Nearby dipole (Solvent/Quencher): Excited e- interacts with a nearby ground state e- dipole Internal conversion (Fluorophore): Excited e- loses energy internally, through direct interactions with other electrons or by adopting a more favorable spin state
Fluorescence Lifetime The Fluorescence Lifetime is the mean period for which an electron stays in the excited state before emitting a photon [*] = population of excited e- [*]0 = initial population of excited e- The lifetime is the inverse of the rate constant: Fluorescence lifetime is commonly used as an imaging technique because it minimizes the effects of photon scattering Lifetimes are typically in the .1 – 30 ns range
Fluorescence Lifetime Data There are two ways of measuring the fluorescence lifetime: Phase Modulation The ‘direct’ method FT
Fluorescence Anisotropy Fluorescence anisotropy results from preferential absorption of light that is polarized in the same plane as the excitation vector During the relaxation phase, the analyte will ‘tumble’ in solution. The plane polarization of the photon emitted will reflect the new (random) orientation, thus: FA is related to the rotational diffusion coefficient by: For real fluorophores, we must also deal with fluorescence relaxation and limiting anisotropy:
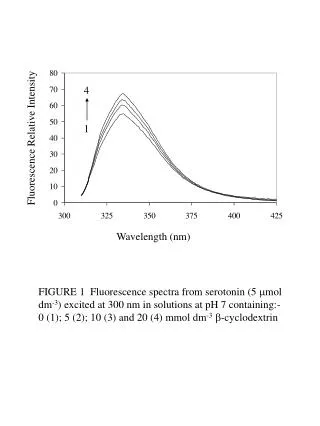
Intrinsic Fluorescence in Proteins Most biological molecules are essentially non-fluorescent (DNA and RNA are very weakly fluorescent @ 330 nm) But there are three fluorophoric amino acids: Tyrosine (274303 nm) = .14 Tryptophan (280~348 nm) = .20 Phenylalanine (257282 nm) = .04 Of these, Tryptophan is by far the most useful, but is very sensitive. Can range from 0 – 1 depending on environment.
Tryptophan Fluorescence Absolute fluorescence intensity doesn’t tell us anything specific about the environment of the fluorophore But the emission does: Tryptophan fluoresces at ~345 nm in water, but ~330 nm in apolar solvent Under most circumstances, tryptophan fluorescence is reduced upon exposure to water, but not always…
Fluorescence Quenching in Proteins Tryptophan fluorescence is commonly quenched by two factors: Proximity to protonated acidic residues such as Asp or Glu Proximity to resonant ligand (usually Heme):
Artificial Fluorescent Probes Oftentimes, especially with other biological macromolecules, there is no suitable fluorophore, so: Covalently bind fluorescent ‘probe’: Non-covalent probes: Do the measured properties of the molecule remain the same??
Förster Resonance Energy Tranfer (FRET) Förster resonance energy transfer occurs when one fluorophore ‘donates’ it’s excitation energy to a second fluorophore. The efficiency of FRET pairs depends on the overlapintegral between the emission spectrum of the donor and the absorption spectrum of the acceptor:
FRET is a ‘Molecular Ruler’ The reason that FRET is so useful is that, assuming fluorophores and solvent conditions are constant, the transfer efficiency is directly related to theproximity. r = the distance between donor and acceptor and R0 is the Förster radius (distance at which FRET efficiency is 50%) 2 = dipole orientation factor (0-4), n = refractive index of medium (1.333 in H2O @ 20°C), D quantum yield of the donor and Ioverlap is the overlap integral
Artificial FRET Probes There are lots of companies selling FRET probe pairs. The goal is to get the right excitation and emission while maximizing the overlap integral. CellTrace™ calcein violet AlexaFluor™ 680 Bad FRET Pair! CellTrace™ calcein violet AlexaFluor™ 514 Good FRET Pair! http://www.probes.com/servlets/spectraviewer?fileid1=453h2o
FRET Probes: GFP Family FRET The family of fluorescent proteins The GFP chromophore S65T is much more efficient Different chromphores give different ex and em
Fluorescence: Instrumentation A basic fluorimeter should look a lot like a UV/visible Spectrophotometer. We need: A light source (Xenon - we don’t care if it’s a bit noisy) A monochromator (sometimes not Czerny-Turner: We don’t require <1 nm resolution of excitation) A sample compartment A photomultiplier (usually of the ‘red sensitive’ variety to help with measurements at longer wavelengths)
Applications: Equilibrium Protein Folding Fluorescence is the preferred spectroscopic technique for equilibrium protein folding experiments It is most often used as a ‘tryptophan environment’ probe Which depends more on tertiary structure than secondary structure So Fluorescence is often used in conjunction with CD222nm as a means of detecting equilibrium folding intermediates Biophys. J., 93 (5): 1707-1718, 2007
Applications: Time Resolved Fluorescence The extreme sensitivity and high duty cycle of Fluorescence measurements make it an excellent tool for ‘time resolved’ kinetic studies Fluorescence increasese upon zinc binding Hydrophobic collapse? 3D Fluorimetry uses CCD detector Biophys. J. 93 (1): 208-217 2007 Biophys. J. 93 (1): 218-224 2007
Fluorescence Applications: FRET Folding FRET probes are very useful in protein folding experiments as they permit direct measurements of inter-residue distances during folding Nucleosome Core Particle With FRET probes (W donor, modified C acceptors)
Applications: Single Molecule Fluorescence is so sensitive, detection of single molecules is possible. Common applications are in biophysics:
Applications: Single Molecule FRET Single moleucle FRET is a power tool for protein folding studies Looking to prove ‘downhill’ folding A ‘bimodal’ distribution indicates two states Proc. Nat. Sci. USA (2007) 104 (1): 123-127
Time-Resolved, Single Molecule FRET Single molecules can be monitored as a function of time by trapping them in tethered large lipid vesicles Labeled GCN4, TMR Donor, Texas Red acceptor Biotinilated Lipid Vesicle Streptavidin monolayer Denaturant concentration near Tm
Single Molecule Instrumentation Instruments for single molecule studies are complex, often due to the need to ‘trap’ the sample using (red) lasers
Fluorescence: Anisotropy Fluorescence Anisotropy can be used to measure binding stoichiometry Protein HU titrated into saturating DNA Anisotropy goes up due to rotational restriction of fluorescent probes on binding Biochemistry (2003) 42 (10): 3096-3104
Kinetics of Anisotropy Decay Fluorescence anisotropy decays at a rate that depends on the rotational diffusion of the analyte Anisotropy Fluoresence Parallel Fluorescence 90° Biophys J. (1990), 57(4): 759–764.
Fluorescence: Cellular Methods Fluorescence microscopy is a very popular way of getting ‘sub-cellular localization’ of a protein. The analyte is usually made a GFP fusion. Virology (2008), 370 (1) Co-localized proteins (HEV replicase and ER proteins) are Yellow!
Fluorescence: Super Cool Technology Dr. Robert Birge has invented a number of computer component devices using the fluorescence of Bacteriorhodopsin
Fluorescence: Temperature Effects UV/Visible and CD are Absorption techniques: The electron absorbs energy from the photon, gets to an excited state.