Download
1 / 34
340 likes | 470 Views
BioMedSci 231 27 February 2008 Draft lecture Fluorescence in the study of membrane proteins Counting transporter molecules FRET analysis of nicotinic receptor assembly Fluorescence imaging ratio of nicotinic receptor assembly. Henry Lester.

E N D
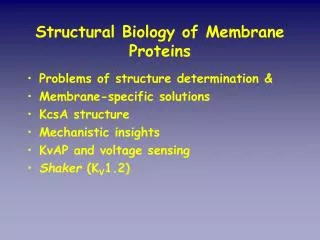
BioMedSci 231 27 February 2008 • Draft lecture • Fluorescence in the study of membrane proteins • Counting transporter molecules • FRET analysis of nicotinic receptor assembly • Fluorescence imaging ratio of nicotinic receptor assembly Henry Lester
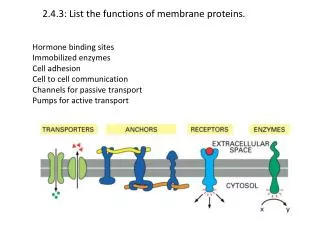
Strategy for quantitative data on transporter localization at synapses
A fusion protein: mouse GABA transporter (mGAT1)-GFP NH2 COOH
CO2- GFP A C-terminal mGAT1-GFP fusion localizes partially to the membrane when expressed in HEK 293 cells NH2 CO2- NH2 GFP-mGAT1 mGAT1-GFP
mGAT1-GFP has functional characteristics identical to mGAT1 when tested in HEK 293 cells
spacer-GFP-stop loxPloxP mGAT1-GFP fusion construct for homologous recombination part of mGAT1 genomic DNA Exon 15 Intron 14 DT stop neo pKO 907 Diphtheria toxin
spacer-GFP-stop neo DT pKO 907 loxPloxP Diphtheria toxin 1 2 3 M 4 5 6 PCR screening identifies ES cells carrying the mutant gene. 4.5 kb mGAT1-GFP fusion construct for homologous recombination part of mGAT1 genomic DNA Exon 15 Intron 14
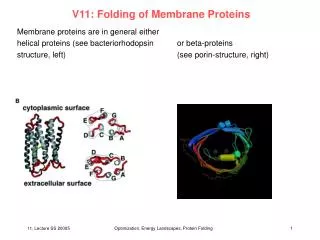
cerebellum Fluorescence in the brain of an mGAT1-GFP knock-in mouse
<Immunocytochemistry (Radian et al) Molecular layer (basket cells stain) Purkinje cell layer “pinceux” stain heavily Granule cell layer
GFP fluorescence > <Immunocytochemistry (Radian et al) Molecular layer (basket cells stain) Purkinje cell layer “pinceaux” stain heavily Granule cell layer
GAT1-GFP expression in cerebellum: basket cell terminals in molecular layer 50 mm
A B untreated boutons translocation treatment beads C D The data suggest: the intracellular GAT1-GFP (31-33% of GAT1 in WT; 80% in mGAT1-GFP) is so close to the membrane that it appears membrane-bound in the confocal microscope. 0.5 mM
Schematic drawing of a chandelier cell based on immunostaining for parvalbumin in human neocortex Ch terminals from Felipe et al, Brain (1999) 122, 1807
Include beads with EGFP-labeled cells in the fluorescent microscope Calibrations: Transparent 90-mm dia beads with calibrated surface densities of EGFP Incubate Ni-NTA beads with measured numbers of His6 EGFP molecules various [His6GFP]
Single-molecule and macroscopic measurements of GFP density - absolute calibration - accurate within 20% - over 4 orders of magnitude - useful on both wide-field and confocal microscopes
Molecular layer of cerebellum Total GAT1/bouton: 9000 Volume density 5000 GAT1/mm3, Surface density 1340 GAT1/mm2. Axons: 640 GAT1/mm Cartridge in cortex contains 365,000 GAT1 Pinceaux in cerebellum 7.8 million GAT1, at a volume density of 7700 GFP/mm3
Nearly Complete Nicotinic Acetylcholine Receptor, a Well-Studied Cys-loop Receptor ~ 2200 amino acids in 5 chains (“subunits”), MW ~ 2.5 x 10⁶ Binding region Membrane region Colored by secondary structure Colored by subunit (chain) Cytosolic region (incomplete)
Upregulation as a thermodynamic consequence of nicotine-receptor Interactions Nicotine accumulates in cells Binding eventually favors high-affinity states Bound states with increasing affinity unbound + + 1 mM Nicotine+ (pKa = 7.9) + C Highest affinity bound state AC -70 mV 0 mV Free Energy A2C A2O A2D Reaction Coordinate 15 mM Nicotine+ Nicotine may stabilize subunit interfaces Covalently stabilized AR*HS ? + nicotine RHS RLS Increasingly stable assembled states Degradation Free subunits Nicotine Increased High-Sensitivity Receptors Free Energy Reaction Coordinate hr 0 20 40 60 Fluorescence assays for receptor changes in response to chronic nicotine?
We avoided targeting and signaling motifs 360 360 VHHRSPRTH TMPAWVRRVF LDIVPRLLFM KRPSVVKDNC RRLIESMHKM ANAPRFWPEP ESEPGILGDI CNQGLSPAPT FCNRMDTAVE TQPTCRSPSH KVPDLKTSEV EKASPCPSPG SCHPPNSSGA PVLIKARSLS VQHVPSSQEA AEGSIRCRSR SIQYCVSQDG AASLTESKPT GSPASLKTRP SQLPVSDQTS PCKCTCKEPS PVSPITVLKA GGTKAPPQHL PLSPALTRAV EGVQYIADHL KAEDTDFSVK EDWKYVAMVI DR VHHRSPTTHT MAPWVKVVFL EKLPTLLFLQ QPRHRCARQR LRLRRRQRER EGAGTLFFRK GPAADPCTCF VNPASMQGLA GAFQAEPAAA GLGRSMGPCS CGLREAVDGV RFIADHMRSE DDDQSVREDW KYVAMVIDR 400 400 440 440 a4 M3-M4 IC Loop b2 M3-M4 IC Loop 480 459 520 360 360 VHHRSPRTH TMPAWVRRVF LDIVPRLLFM KRPSVVKDNC RRLIESMHKM ANAPRFWPEP ESEPGILGDI CNQGLSPAPT FCNRMDTAVE TQPTCRSPSH KVPDLKTSEV EKASPCPSPG SCHPPNSSGA PVLIKARSLS VQHVPSSQEA AEGSIRCRSR SIQYCVSQDG AASLTESKPT GSPASLKTRP SQLPVSDQTS PCKCTCKEPS PVSPITVLKA GGTKAPPQHL PLSPALTRAV EGVQYIADHL KAEDTDFSVK EDWKYVAMVI DR VHHRSPTTHT MAPWVKVVFL EKLPTLLFLQ QPRHRCARQR LRLRRRQRER EGAGTLFFRK GPAADPCTCF VNPASMQGLA GAFQAEPAAA GLGRSMGPCS CGLREAVDGV RFIADHMRSE DDDQSVREDW KYVAMVIDR 560 400 400 600 CFP 440 440 602 YFP 480 459 520 PKA PKC Tyrosine kinase Casein kinase Calmodulin dependent kinase II Cyclin dependent kinase 5 560 600 602 CFP YFP Ubiquitination motifs: K Endocytosis motifs: YXXf, f = M, L, F; LLER retention motifs: R/K-X-R/K, R/K-R/K Amphipathic helix contains ER export motifs: Ds and Es Candidate fluorescently tagged a4 and b2 subunit constructs a4 nAChR b2 nAChR 1 aa 1 aa 629 aa 501 aa M1 M2 M3 IC loop M4 Ligand-binding domain c-myc tag CFP HA tag YFP b2-CFP-C a4-YFP-N1 XmaI (34 aa) HA tag YFP HA* tag c-myc tag CFP b2-CFP-M a4-YFP-N2 XmaI (34 aa) PPUMI (381 aa) HA tag YFP a4-YFP-M BStEII (426 aa) Raad Nashmi
m = monomeric Analogous functional but less extensive fluorescent series C. elegans GluClα, Gluclβ α6 β3 (selective neuronal silencing (dopaminergic neurons) A collection of fluorescent Cys-loop receptor subunits α4 β2 aa 1 aa 629 aa 1 aa 501 M3 - M4 loop M3 - M4 loop Ligand binding M1 M2 M3 M4 M4 HA tag XFP c-myc tag XFP β2-XFP-M α4-XFP-M FRET pairs Cerulean mCerulean ECFP mECFP EGFP mEGFP EYFP mEYFP Venus mVenus mCherry XFP = λ
There are 3C2 = 6 interesting genotypes of fluorescent nAChR a4 mutants All phenotypes are viable & neo-deleted YFP, Leu9-Ala-YFP, CFP Raad Nashmi
From Roger Tsien’s notes II. How is FRET detected and measured? A. Decrease in donor fluorescence or quantum yield: E = (FD - FDA)/FD 1. Need FD, donor fluorescence under identical conditions but with no acceptor nearby, i.e. before acceptor added or after acceptor bleached or split off B. Decrease in donor excited state lifetime: E = (D - DA)/D C. Decrease in rate of donor photobleaching D. Sensitized emission from the acceptor is proportional to EQA 1. Sensitized emission generally contaminated by long-wavelength tail of donor emission and direct excitation of acceptor; both must be deducted by multiwavelength measurements 2. For r << R0, sensitized emission may disappear due to other quenching mechanisms operating at very short distances E. FRET-mediated emission from the acceptor is less polarized than if acceptor had been directly excited – useful for detecting FRET between identical molecules (homotransfer, donor-donor transfer. “anti-Stokes” effect) F. Distinguish FRET from trivial absorption followed by re-emission
Older microscopes could image at only a few wavelengths, using interference filters Lakowicz 13-13
Modern microscopes can record an entire spectrum (at 5 nm intervals) for each pixel, Enabling us to analyze the relative amount of each fluorescent component Spectrum = a(donor) + b(acceptor) Lakowicz 13-13
FRET is useful because R0 is on the order of protein sizes (16 -56 Ǻ) • Efficiency of energy transfer E is the fraction of photons absorbed by the donor which are transferred to the acceptor. • Therefore a nonfluorescent donor can still participate in RET • 2. Poorer RET smaller R0 Lakowicz 13-1, 2
Intercept = 0.24 FRET efficiency = 1- (1/(1 + Intercept)) = 19.4% 0 20 40 60 80 100 FRET measurements by acceptor photobleaching (donor dequenching) 0 20 40 60
Fluorescent subunits tell us about nicotinic receptor assembly * a4/b2Y/b2C a4Y/a4C/b2 a6Y/a6C/b2 a4/b2/b3Y/b3C Neuro2a Ryan Drenan
50% α-CFP, 50% α-YFP 1/4 1/4 1/2 E No FRET b/a =1.62; 1.62-6 = 0.055 1/8 1/8 1/8 100% α3β2 E1 E2 E3 E4 100% α2β3 No FRET % receptors with α3 1/8 1/4 1/4 Theory of FRET in pentameric receptors with αnβ(5-n)subunits
Data: Changes in subunit stoichiometry caused by varying subunit expression levels Cagdas Son
The key experiment: changes in subunit stoichiometry caused by chronic nicotine! Cagdas Son
Fluorescence Intensity Ratio Analysis of Subunit Stoichiometry (Hummer, Delzeith, Gomez, Moreno, Mark, & Herlitze (2003), JBC 278, 49386
Fluorescence Intensity Ratios Also Yield Overall Subunit Stoichiometry: a4/b2 = √(k1/k2) a4CFP b2YFP a4YFP b2CFP cDNA: 1:9 a:b CFP intensity YFP intensity Cagdas Son