Download

1 / 9
90 likes | 165 Views
Learn how to export measurement data from Velleman scope to Excel for analysis. Set up formatting, scaling, and processing steps for accurate results.

E N D
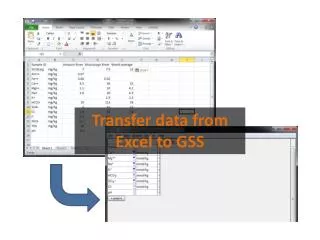
Save DSO Data After you have made measurements using the Velleman scope, you can save the data as a .txt file using the option File/Save DSO Data. A pop-up window will open to allow you to name the text file and save it in a folder that you specify. The default folder is My Documents/My PCSGU250.
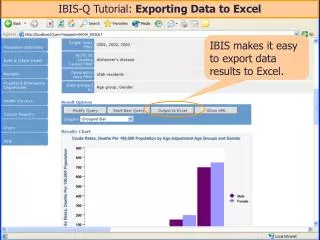
Open the .txt file in Excel • Launch Excel. • Open the .txt file using File/Open. • Since the file is not in the expected Excel format, you have to specify how the data will be read into Excel.
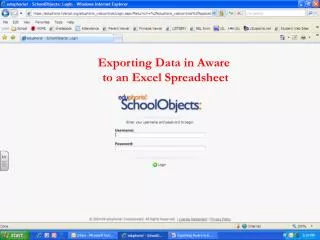
Formating .txt File Select Delimited, which should be the default when the first pop-up window opens. Then click Next.
The Delimiters selected must include Tab, but can also include Space if you want to have the TIME STEP data in separate columns. Click Finish as there is nothing in the third pop-up window that must be changed.
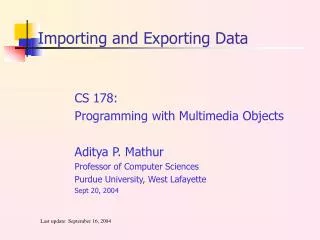
Scaling Required: Time To determine the time to print on the x-axis: Look at TIME STEP: for the number of points that are equal to a time increment. In this example, 125 = 1ms.This means that the time for each point in the column under N should be divided by 125 and then multiplied by 1ms to determine the time at which each voltage data point was taken.
Scaling Required: Ground You have to subtract the value listed for GND (177 for CH1 and 97 for CH2 in this example) from the values listed below CH1 and CH2 to removed a DC offset in the DSO data to establish where ground (0 V) is in the data sets.
Scaling Required: Absolute Voltage To determine the voltage associated with each data point for Channel 1 and Channel 2: Look at the numbers next to CH1: and CH2: above the GND row. In this example, 1V is equivalent to 32for both CH1 and CH2 (which is not always the case).This means that that the value of the points in the columns CH1 and CH2 should be divided by 32 and then multiplied by 1V to finally obtain the voltage measured by the oscilloscope on Channels 1 and 2 as a function of time.
After performing the calculations, you will have the voltage measurements as a function of time for Channel 1 and 2. You can use this data to complete your lab reports rather than read data using the cursors with the scope program. Seconds Volts Volts