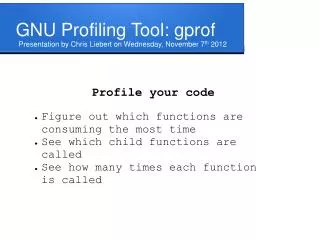
GNU gprof Profiler
GNU gprof Profiler. Yu Kai Hong Department of Mathematics National Taiwan University July 19, 2008. GNU gprof 1/22. Two types of time profilers. Built-in UNIX time profiler - Unix C shell - Others


GNU gprof Profiler
E N D
Presentation Transcript
GNU gprof Profiler Yu Kai HongDepartment of MathematicsNational Taiwan UniversityJuly 19, 2008 GNU gprof 1/22
Two types of time profilers • Built-in UNIX time profiler - Unix C shell - Others • GNU gprof time profiler GNU gprof 2/22
Built-in UNIX time profiler • The simplest one. • Does not increase extra time cost. • Does not provide subroutine relative graph. • Does not have to recompile source code. GNU gprof 3/22
Built-in UNIX time profiler • Unix C shell 14.918u: elapsed user time 0.016s: elapsed system time 0:15.61: total elapsed time 95.5%: percent of total CPU usage 0+0k: shared/non-shared memory 0+0io: times for performing input/output GNU gprof 4/22
Built-in UNIX time profiler • Others real 0m15.456s: total elapsed time user 0m14.990s: user elapsed time sys 0m0.015s: system elapsed time GNU gprof 5/22
GNU gprof time profiler • Detail time statistics for each subroutine. • Create relative graph for all subroutines. • Analysis the program bottleneck. • Increase about 30% extra time cost. GNU gprof 6/22
GNU gprof time profiler • Recompile the original source code -pg: This option affects both compiling and linking. Add additional commands into source code when compiling code in order to trace all subroutines. Add essential initial settings and statistical processes when linking the objects. GNU gprof 7/22
GNU gprof time profiler • Convert produced profile data into text file - ListOfOptions can be omitted. - ExecuteFile can be omitted when the file name is a.out. - StatFiles can be omitted when the file name is gmon.out. GNU gprof 8/22
GNU gprof time profiler • List of Options -b: omit the table or data illustration on OutputFile. -e(E)SRName: exclude the subroutine SRName from the table (and exclude its elapsed time). -f(F)SRName: only display the subroutine SRName on the table (and its elapsed time). GNU gprof 9/22
GNU gprof time profiler • List of Options -s: combine more than oneStatFile into single one with default file name gmon.sum. -Z: only display all subroutines table which are unused on the program. GNU gprof 10/22
GNU gprof time profiler • Example Program subroutine relative graph GNU gprof 11/22
GNU gprof time profiler • Example Program GNU gprof 2/22
GNU gprof time profiler • Example Program GNU gprof 13/22
GNU gprof time profiler • Example Program % time: the percent of self seconds from total program elapsed time. cumulative seconds: the seconds cumulate from self seconds. self seconds: total elapsed time called by its parents, not including its children’s elapsed time. equal to (self s/call)*(calls) GNU gprof 14/22
GNU gprof time profiler • Example Program calls: total number for each subroutine called by its parents. self s/call: elapsed time for each time called by its parents, not including its children’s elapsed time. total s/call: total elapsed time called by its parents, including its children’s elapsed time. name: subroutine name. GNU gprof 15/22
GNU gprof time profiler • Example Program GNU gprof 16/22
GNU gprof time profiler • Example Program GNU gprof 17/22
GNU gprof time profiler • Example Program GNU gprof 18/22
GNU gprof time profiler • Example Program [ ] index value for each subroutine GNU gprof 19/22
GNU gprof time profiler • Example Program See the second part. A on the left-most means the relation is viewed for A. B1 and B2 are below of A means A is the parent of B1 and B2 (A calls B1 and B2), main is above of A means A is the child of main (A called by main). GNU gprof 20/22
GNU gprof time profiler • Example Program See the second part. 1/2 means subroutine B2 is called by its parents total two times and A calls it only one time. 1 means subroutine A have only one parent. GNU gprof 21/22
GNU gprof time profiler • Example Program See the second part It is viewed for subroutine A. The elapsed time of A’s children is 37.60 seconds and B1’s children is 33.52 seconds. Especially, B2’s children is 0 second since B2 doesn’t have any child. GNU gprof 22/22