Download
1 / 9
90 likes | 285 Views
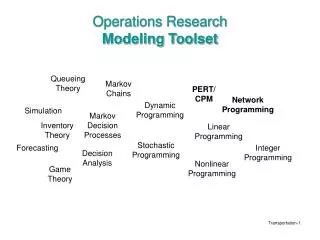
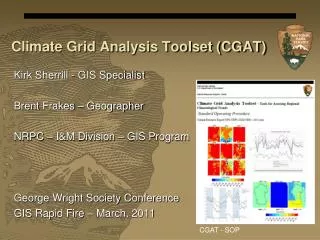
Climate Grid Analysis Toolset (CGAT). Kirk Sherrill - GIS Specialist Brent Frakes – Geographer NRPC – I&M Division – GIS Program George Wright Society Conference GIS Rapid Fire – March, 2011. CGAT - SOP. What is CGAT?. Toolset for Assessing Regional Climatic Variability

E N D
Climate Grid Analysis Toolset (CGAT) Kirk Sherrill - GIS Specialist Brent Frakes – Geographer NRPC – I&M Division – GIS Program George Wright Society Conference GIS Rapid Fire – March, 2011 CGAT - SOP
What is CGAT? • Toolset for Assessing Regional Climatic Variability • Packaged in a suite of GIS Python Scripts • Facilitate the use of PRISM and SNODAS gridded datasets. • Intended to help Land Managers develop accurate and park wide, baseline representations of historical climatic conditions NRPC - Inventory & Monitoring Program
PRISM Data – PRISM Climate Group at Oregon State University • Spatial continuous for the continental US • 4km cell size • Monthly and Yearly temporal resolution • Data Archive 1895 – Present • PRISM Variables • PPT, TMAX, TMIN, TDMEAN • PRISM group website • http://www.prism.oregonstate.edu/ NRPC - Inventory & Monitoring Program
SNODAS Data – modeled by the NOAA National Weather Service’s NOHRSC • Available for the continental US • 1km cell size • Daily temporal resolution • Data archive from 2003 – Present • 8 SNODAS Climatic Variables • SWE, SNOW Depth, Snow Melt Runoff, Snowpack Sublimation, Blowing Snow Sublimation, Solid & Liquid Precipitation, and Snow Pack Average Temp. • SNODAS website • http://nsidc.org/data/docs/noaa/g02158_snodas_snow_cover_model/index.html NRPC - Inventory & Monitoring Program
CGAT – 3 Analyses • 1. Cell Based Average/Total • Monthly or Yearly (Time Step) • Used to develop the baseline values to be evaluated across the desired temporal range of interest SNODAS 2010 Total Solid Precip, for ROMO NRPC - Inventory & Monitoring Program
Percentile Calculation • - Using the average or total data layers • - Percentile by Reference Date (month or Year) vs Temporal Range of Interest N = number of values by Cell n = rank of N percentile date across all N values ordered from least (1) to greatest (N). Annual TMIN percentile calculations for each year between 2001-2009 versus the thirty year period between 1971-2000 for ROMO (outline in black). NRPC - Inventory & Monitoring Program
3. Zonal Calculation • - Calculates summary statistics for Regions of Interest Graph of annual precipitation 1980 – 2009 for four NHD hydrological units in ROMO. NRPC - Inventory & Monitoring Program
In Summary: • Toolset facilitating the use of PRISM and SNODAS Data • CGAT Working Environment • Runs in the Python Scripting Language • Computer with ArcGIS 9.3 or ArcGIS 10 functionality • The CGAT Scripts and SOP Download: • http://nrinfo.nps.gov/ - Search for “CGAT” • CGAT is the gridded climatic data component of an I&M Weather and Climate Data project: http://nrinfo.nps.gov/ - Search for “Enterprise Climate Database” NRPC - Inventory & Monitoring Program
Thanks and Questions? NRPC - Inventory & Monitoring Program