Download
1 / 19
190 likes | 296 Views
Explore the impact of melting ice sheets on global sea level rise, glacial retreat, thermal expansion, and the forecasted rise leading to coastal vulnerability. Understand the key factors influencing sea level changes and potential consequences for inhabited coastlines.

E N D
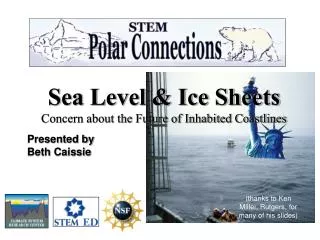
Sea Level & Ice Sheets Concern about the Future of Inhabited Coastlines Presented by Beth Caissie (thanks to Ken Miller, Rutgers, for many of his slides)
Sources: Petit et al. (1999) Nature 399, 429-436 and National Oceanic and Atmospheric Administration (NOAA), USA
Sea level history over the past 450,000 years Source: Labeyrie et al (2003) In: Paleoclimate, Global Change and the Future, Springer.
Last interglacial Global Sea Level TODAY Full Glacial Lambeck et al., 2002, based on tropical & subtropical records
Ice from the Ocean makes ice sheets, so sea level drops • When Ice sheets melt, sea level goes up.
Antarctica West East
Why Is Global Sea Level Rising Today? • Melting Ice Caps and Glaciers: • Melting land ice adds to ocean volume (sea ice does not) • Greenland is thinning today, but didn’t disappear during the Last Interglacial . • IPCC2001: near 0 • Cazenave & Nerem (2004): >0.15 mm/yr • Sterns & Hamilton (2007): 0.57 mm/y
Why Is Global Sea Level Rising Today? Muir Glacier • Glacial Retreat • Most glaciers world-wide are in retreat • Alpine glaciers contribute 0.6 mm/yr to sea level rise • Why are some advancing? • Increased snow 1941, William Field 2004, Bruce Molnia From the Glacier photograph collection. Boulder, Colorado USA: National Snow and Ice Data Center/World Data Center for Glaciology. http://nsidc.org/data/glacier_photo/repeat_photography.html
Why Is Global Sea Level Rising Today? • Thermal Expansion: • ocean has gained heat • Warmer water less dense global 20th century warming ~0.6°C • 1.6 mm/yr sea-level rise
Should I Sell My Shore House? Brazil Atlantic City NJ
Observations(Tide Gauge and Satellite Altimetry Data) • Overall 10-20cm rise in 20th century • 20th century average rate of sea level rise: 1.7±0.3mm/yr • 1950-2000 1.8±0.3mm/yr • 1993-2003 accelerated to 3.1±0.7 mm/yr
Sea-Level Forecast: IPCC 2007 40 cm (1.25 ft) rise by 2100 1 m (3.3 ft) by 2200 IPCC 2007 error: 20-60 cm (does not include ice sheet melting) 2007 http://www.realclimate.org/images/sealevel_1.jpg
Recent Global Sea Level Rise Estimates Slide from Rahmstorf web site Data: Church and White (2006) Scenarios 2100: 50 – 140 cm (Rahmstorf 2007) 55 – 110 cm (“high end”, Delta Committee 2008) Scenarios 2200: 150 – 350 cm (“high end”, Delta Committee 2008) Scenarios 2300: 250 – 510 cm (German Advisory Council on Global Change, WBGU, 2006) WBGU Delta Comm. Rahmstorf Data Best Estimate = 80 cm of SL Rise by 2100, 1 m is not out of the question
Long Beach Island, NJ Human stabilized 400 m Natural movement Courtesy N. Psuty
(from Day After Tomorrow) Sea Level Rise – like this? No ! Gradual sea level rise and storm events causing this? Highly likely! http://www.learnnc.org/lp/editions/cede_smsandvol/323
The Nile River Delta 1 m SL Rise would impact 6.1 Million people 4500 km2 cropland
Boston http://www.geo.umass.edu/stategeologist/frame_maps.htm