Download
1 / 38
380 likes | 536 Views
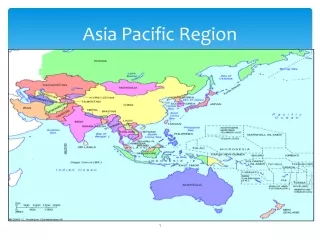
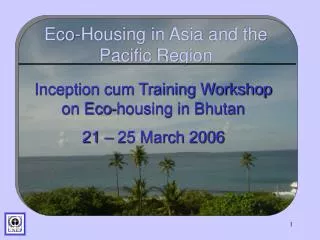
Eco-Housing in Asia and the Pacific Region. Inception cum Training Workshop on Eco-housing in Bhutan 21 – 25 March 2006. Population. Asia & Pacific. Nearly two-thirds of world population growth is in Asia Nearly 50 million peoples are being added to Asia every year. Population.

E N D
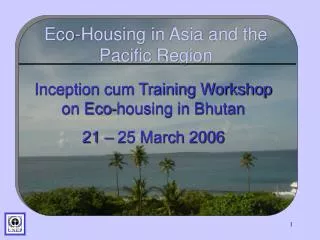
Eco-Housing in Asia and the Pacific Region Inception cum Training Workshop on Eco-housing in Bhutan 21 – 25 March 2006
Population Asia & Pacific • Nearly two-thirds of world population growth is in Asia • Nearly 50 million peoples are being added to Asia every year
Population • Projected population in Asia: 4.88 billion by 2030 Source: World Population Prospects: The 2002 Revision
Urbanization • Asia will have an urban population of 2.6 billion by 2030 Asia Growing urban proportion 54% (2.6 billion) 37% (1.4 billion) Urban Population (Millions) 24% Source: World Population Prospects: The 2002 Revision
GDP Growth Forecast 2003-2015 6.0 3.1 3.1 2.3 • The global economy is expected to grow at 3.1% during the 2002-2015 • Asian economy is projected to be growing at 6% during the same period Source: Global Economic Prospects 2003, World Bank
Emerging Middle Class Middle class (million) based on the number of people who can buy automobiles • 60s and 70s: if a Chinese person wanted to buy a bicycle, he had to save for a few years • Now: for some middle class families, it would only take 2 to 3 years to save and buy a car
Growing Service Sector Share of service sector in global economy Projections 60% 38%
Emissions from mobile source Europe USA & Canada Asia SO2 emissions2 Mobile sources are the major emitters of NOx,CO, particulates, and HC, and in addition contribute to SOx, lead and CO2. 110 million tons 80 million tons Mobile sources contribution in Shanghai1 CO HC NOx Current 75% 93% 44% 2010 94% 98% 75% (million metric tons per year) Source: 1. SEI (2003); 2. www.wri.org
Impacts of Air Pollution at Different Scales Global Regional Urban Indoor
Health impacts of air pollution Regional air pollution Urban air pollution Indoor air pollution Scale of health impacts
Health Costs of Air Pollution • Asia1 • An estimated 487,000 premature deaths occur each year due to outdoor air pollution. • China2 • Environmental and health costs of air pollution in China is about 7 % of GDP [budget deficit in 2003 = 3.3% of GDP]5 • Estimates shows that these costs could rise to 13% of China’s GDP by 2020 • Bangkok • Health cost of air pollution • $640 million • $800 million by 2020 Economic Implications of Health Impacts4 Bangkok Exposed to diesel exhaust6 Exposed to clean air6 Source: 1. WHO(2002); 2. State of the World 2003, World Watch Institute; 4. URBAIR project; 5. UN, 2004; 6: NIES, www.nies.go.jp
Costs of Air Pollution Air pollution is becoming a major health threat in Asian cities “An estimated 487,000 premature deaths in Asia occur each year due to outdoor air pollution”1 “ A total of 3,547 persons were killed in international terrorist attacks in 2001”2 1. WHO (2002);2. USDoS(2002)
Impact: water quantity 2003 Increasing supply to cities 105 million tons grain short fall (largest in the record) Increasing temperature Decreasing supply to agriculture Decreasing water table 2004 Need to produce 105 m tons (2003 short fall) 15 m tons (to feed 74 m people who was added in 2004) • 3 of the 4 warmest years on record came during the last 4 years • 2004 projected to be the 5th consecutive year in which the harvest falls short of consumption
Impact: water quality Urban centers contribute more than 25% of the sewage in India • 63% of population in Asia without access to clean water • Infant mortality rates are 10 to 20 times higher in cities without adequate water and sanitation
Import of Petroleum: burden on national budget Total Asian Oil Consumption by 2010 (Barrel / Day)1 Need to be imported from outside the region [18 – 24 million b/d] India spends over $3.5 billion on crude petroleum import annually2. Gasoline consumption trends in Shanghai, China3 Source: 1. Harvard International Review (2003); 2. ESCAP Statistical Year Book 2002; 3. M.P. Walsh, US AEP 2000
Global Primary Energy Use Source: 1. Volt Viewtech (www.energyloans.org)
Emissions from residential areas 4,535 Kg of CO2 / year 9,979 Kg of CO2 /year • Average home emit more than twice as much carbon dioxide as the average car1 Source: 1. Volt Viewtech (www.energyloans.org)
Prevention: Turning the environmental degradation curve Business as usual scenario Environmental degradation Prevention measures such as renewable energy sources Economic development
Prevention Vs Mitigation/rehabilitation Rehabilitation Costs of implementation Mitigation Prevention Costs of damage Prevention Mitigation Rehabilitation 99% efforts Today Tomorrow 99% efforts Today & Tomorrow
Hybrids Price: $20,810 MSRP Fuel efficiency: 23 Km / litre Saving: $5,000 over 15 years Reduces CO2 by 50% CO, HC and NOx by 90% below Japanese standards. Toyota Prius Hybrid
SOLVE SOCIAL, ECONOMIC AND ENVIRONMENTAL ISSUES SOCIAL BENEFITS • create domestic jobs • electricity to remote areas which are not in the national power grid Hydrogen Energy ECONOMIC BENEFITS ENVIRONMENTAL BENEFITS • eliminate our dependence on foreign oil • solve our balance of payments woes • export opportunities • solve our air pollution problems • eliminate oil spills • reduce noise pollution water H2O
83,000MW Less than 1.2% of economic potential 42,000MW Hydropower potential in Nepal WATER RESOURCES IN NEPAL Nepal is reach in water resources and among the world’s top 5 countries in hydropower potential. H2O
Prevention Technical measures Mobility Legal & financial Technical measures Housing Legal & financial
Knowledge building and education Networking Demonstration Projects Regional Expert Consultation First Expert group meeting; 13 September 2005 3 groups were formed, and each of them are bringing out a white paper on it.
General Objective: • promote eco-friendly buildings. • Specific Objectives: • demonstrate the suitability and technological feasibility. • create awareness about the sustainability of eco-friendly buildings, leading to their wider acceptance and use. Objectives
Regional expert group • Develop generic designs for the different climatic zone and economic groups • Assist in constituting a National Task Force (NTF) • Design tailored to each of the selected countries • Enhance the capacity of national technical committee • Assist in the construction in selected countries • Facilitate wider dissemination of the demonstrated concept • Promotion in other countries of the region Demonstration Project: Scope
Scope Phase 3: Evaluation and dissemination Phase 2: Training and construction Phase 1: Development of guidelines and design
Phase 1: Development of Guidelines and Design • Generic guideline • National Inception workshop • Site specific guideline • Training selected local architects • Detailed design by the local architects • Review and finalization of the design
Phase 2: Training and Construction • Identify builders for implementing the construction • Implement the demonstration project with participation of entrepreneurs and local stakeholdersSite specific guideline • Training as appropriate
Phase 3: Evaluation and Dissemination • Hand over the building to users • Select agency for upkeep and maintenance of the facilities • Evaluate the impacts of the project with respect to select indicators and make Scenarios for the future based on the project outcomes • Prepare a compendium on the results of the project and dissemination
Potential Partners National Authority Implementing Agency Local Authorities Local architects Regional architects International Agency
Regional National Steering Committee National Focal Points Regional Expert group National Implementing Agencies National Task Force Implementation Arrangement Guidance Technical input Actual construction
Maldives Sri Lanka Indonesia National WS National WS National WS Site Selection Site Selection Site Selection Regional Training Regional Training Programme Site Specific Design Site Specific Design Site Specific Design
Thailand: Change of Policy on Sustainable Urbanization ECO-HOUSING In 2005, the Thai Cabinet approved a project for an eco-city, as a joint venture between the Natural Resources and Environment Ministry, Thailand and UNEP GREEN VEHICLES On July 27, 2004, the Cabinet approved a new vehicle excise tax structure to promote eco-friendly vehicles
New vehicle excise tax structure in Thailand Source: www.krc.co.th
Eco-Towns in Japan The Concept of Kawasaki Eco-Town Reduce environmental impacts throughout the entire spectrum of activities Recycling not only within Individual industrial firms but also among the firms Source: www.kawasaki-net.ne.jp