Download

1 / 37
370 likes | 587 Views
Fresh produce and CEAGESP. Companhia de Entrepostos e Armazéns Gerais de São Paulo Anita de Souza Dias Gutierrez. Summary. Fresh produce consumption evolution Brazilian agriculture Fresh produce value chain CEAGESP. Food and fresh produce. Food First pleasure at birth Satisfy hunger

E N D
Fresh produce and CEAGESP Companhia de Entrepostos e Armazéns Gerais de São Paulo Anita de Souza Dias Gutierrez
Summary • Fresh produce consumption evolution • Brazilian agriculture • Fresh produce value chain • CEAGESP
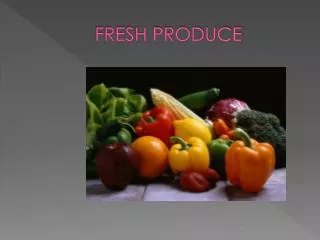
Foodandfreshproduce • Food • Firstpleasureatbirth • Satisfyhunger • Source ofjoy, pleasure, delight, happiness • The #1 reason for foodpurchase • Freshfruitsandvegetables • Symbolofhealth, diseaseprevention, fitness, beauty, freshness • SymbolofNature, freefromfoodindustryand its ingredientes • Consumer’s reason for supermarket choice • Mistery to buy: Is it good to eat? • Best qualityatharvest
Food habits are changing • Consumption of fresh and healthy food grows with GNP per capita in the world and with income level in Brasil
Vegetariancow: symbolofeatingbehaviourchangingtendency David Bowers ilustration
Brasil is a big country • GDP R$ 2,9 trillions • Agriculture R$ 163,5 billions • Indústria R$ 682,5 billions • Serviços R$1.595 billions • GDP per capita US$ 20.000 in 2010 • 2007 - US$ 6.940,00 • 5th largest area • 850 millions hectares • 47% of South America area • 115 millions hectares – Environmental conservation • 109 millions hectares – indian reservation • 62 millions hectares with agricultural crops - 7% total area • Fruits and Vegetables – 26% of agricultural area
Brazilianpopulation • Age • 0 to 15 years – 32% • 15 to 29 years – 28% • 30 a 59 years – 33% • 60 years to – 7% • Population growth rate is falling • Concentration • 18 metropolitan regions – 70 millions (37%) • 2 big metropolitan regions – 31 millions (16%) • 5.564 municipalities • 26 estates e one fedeal district (Brazilia) • Urbanization – 20% in Brasil e 7% in São Paulo • Rural area • 5.204.130 farmers • 18 millions workers
O AGRONEGÓCIO É O NEGÓCIO DO BRASIL 1970 to 2010 Area growth – 27% Production growth – 213% THE AGRIBUSINESS IS THE BUSINESS OF BRAZIL. Confidencial
Fresh produce is unique • High valuation of freshness, appearance and flavour • Perishability • Small, specialized farmers • Specialized whosalers • Seasonal, fragmented production • Farmer´s marketing high fragility • Retail and food service needs fresh and a mix of products every day • A logistic center for reception, consolidation and distribution is indispensable
Common knowledge • Thebestquality is atharvest. • It is onlypossible to mantainqualityafterharvest, not to improve it. • Theproductionofquality is themostdifficulttaskofthefreshproducevaluechain. • Brasil hasconditions to produceduringalltheyear in differentplacesandseasons
Packer-shipper Dealer Farmer Consumer Whosaler Retailer Food Service Freight Fresh produce value chain
Food retail • Supermarkets • GDP – R$ 160 billions • 75.725 stores • 185.889 check-outs • 61% até 7 check-outs • 876.916 employees • 80% of food marketing • Five biggest – 41% of GDP • Fresh fruit and vegetable • 9% of total food value • 19% of perishable food value • Supermarket choice • Fresh fruit and vegetable mix, every day
Food service • 15% growth each year since 2004 • 25% of food expenses • Fresh fruit and vegetable mix, every day • Food service companies • 8,9 milllions of meals each day • 19% of the expense is fresh fruit and vegetables • Potential market – 40 milllions of meals per day • School Food Programa • 47 millions of children per day
Fresh produce terminal markets • CEAGESP – 1969 • State of Sâo Paulo • SINAC – COBAL • Nacional system • 21 terminal markets • 1972 a 1988 • 34 terminal markets – biggest brazilian cities • Most state management not federal • 50% of fresh fruit and vegetable production
CEAGESP - State company - federal government - Fresh produce terminal markets and grain warehouses
700.000 m2 • 10.000 tons per day • 50.000 persons • 2.500 whosalers: 1.190 fruits and vegetables • Origin • 1.500 brazilian municipalities • 25 of the 27 brazilian states • 25.000 growers • 12 countries • 74 fresh fruits and 95 fresh vegetables • 50% of all brazilian terminal markets • Destination – number of buyers • São Paulo Metropolitan Region –76% • São Paulo State interior – 15% • Other 11 brazilian states – 6%
CEAGESP - Services • Everyday market information • Volume and origin • Price • Pesticides’ residue monitoring • Research and development • Partneship with universities and research centers • Development of fruits and vegetables’ quality standards • Variety guide • HortiEscolha – decision tool for food service • Flavour school – child nutrition education • Minimal handling – retail orientation • Training agents of the value chain
CEAGESP • The fresh produce value chain needs logistic centers for reception, consolidation and distribution • Growing production of fresh fruits and vegetables • Growing demand for volume and quality • Growing value differentiation for quality • Facing big challenges • Infrastructure • Logistic • Hygiene • Etc..
Anita de Souza Dias Gutierrez551136433825551136433890cqh@ceagesp.gov.br Fresh produce value chain A world full of challenges and opportunities