Download

1 / 21
210 likes | 224 Views
This research investigates the subjective well-being of adolescents in four Latin languages speaking countries. It compares the results obtained from different scales and items to understand the variations in well-being. The study analyzes the data using multi-group structural equation modeling and discusses the strengths and weaknesses of the scales used. The findings show that adolescents score high in subjective well-being, although it decreases with age. The study also explores the differences in understanding between happiness and satisfaction with life.

E N D
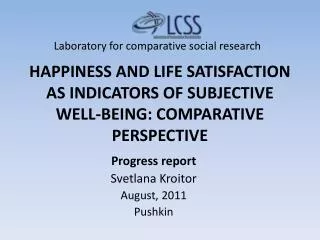
Subjective indicators of adolescents’ well-being. Comparing some results among four Latin-languages-speaking countries. Research Institute on Quality of Life University of Girona (Spain) http://www.udg.edu/eridiqv
Subjective indicators of adolescents’ well-being. Comparing some results among four Latin-languages-speaking countries. Ferran Casas (Coord). http://www.udg.edu/eridiqv Spanish research team: Germà Coenders, Mònica González, Sara Malo, Irma Bertran & Cristina Figuer. Institut de Recerca sobre Qualitat de Vida. Universitat de Girona (UdG). Brazilian research team: Jorge C. Sarriera, Daniel Abs da Cruz, Lívia Bedin & Angela Paradiso. Instituto de Psicologia. Universidad Federal de Rio Grande do Sul (UFRGS). Chilean research team: Jaime Alfaro, Karin Weinreich & Boris Valdenegro. Escuela de Psicología, Facultad de Medicina, Universidad de Valparaíso, Chile. Argentinean research team: Enrique Saforcada & Schelica Elena Mozobancyk (Universidad de Buenos Aires – UBA). Graciela Tonón & Lia Rodríguez de la Vera (Universidad de La Matanza-ULM– & Universidad de Lomas de Zamora-ULZ). Research Institute on Quality of Life University of Girona
Sample of adolescents aged 12 to 16, by age and gender: N=5,673
Mean results for each country with the different scale variations and items on adolescents’ well-being (14-16)
Fit statistics for the SEM (1)(models 1 to 5 are single group on the pooled data set. Multi-group models include Spain, Brazil and Chile)
Fit statistics for the SEM (2)(models 8, 10, 12 are single group on the pooled data set. Multi-group models include Spain, Brazil and Chile)
Standardized estimates for Model 5.Pooled sample of 3 countries: Brazil, Chile and Spain
Standardized estimates for Model 8.Pooled sample of 3 countries: Brazil, Chile and Spain.
Standardized estimates for Model 10. Pooled sample of 3 countries: Brazil, Chile and Spain.
Standardized estimates for Model 12. Pooled sample of 3 countries: Brazil, Chile and Spain.
Standardized Regression Weights for the 3 scales and the OLS
Some topics for discussion (I) • Our results show that adolescents in the four studied countries score high in their subjective well-being, around the highest expected upper limit according to normative values in Western countries (Cummmins & Cahill, 2000), and even above that limit in Brazil. However, it is also evident that their well-being decreases with age in all 4 countries. • It is difficult to be precise with the comparisons because the different wording of each item may have a slightly different meaning in different languages or cultural contexts. • The three multi-item scales used here explore slightly different life domains or aspects of life.
Some topics for discussion (II) • The fact that our models show good fit statistics when using multi-group SEM is a very promising result, showing that although there may be many limitations in the precise comparability of items and scales, the overall measures we have used seem to be comparable among countries for this age group. • The ten studied scales (3 multiple-item, 3 single-item, and 4 single items from a larger scale) and their variations have shown various strengths and weaknesses when used with 12-16 year-old adolescents in four Latin-language-speaking countries. All of them seem to have enough qualities to be potentially used as subjective well-being indicators in the international arena. However, it is also true that results will slightly or even clearly differ across countries depending on the scale used.
Some topics for discussion (III) • The scales including the wording “happiness” show a broader diversity of results than the scales including the wording “satisfaction with life”. • Although it seems clear that among adolescents of the studied age ranges the two concepts are not understood to have the same meaning, they do appear to be related (correlation observed in the pooled sample for the 4 countries is .544). However, SE Models with the three scales, including the OLS and HOL alternatively, show very similar results, with standardized loadings that are high, but not extremely high, suggesting that other additional indicators are probably required for a better explanation of the two constructs. • The different understanding of the two wordings offers us a complex panorama of differences in the statistical results, which will require further research
Some topics for discussion (IV) When comparing the 3 multiple-item scales studied here, some of the most notable results are: • The SWLS has the highest R² when regressed on the OLS. However, these results are probably contaminated by item 3 of the SWLS, which is a higher order item, at least partially redundant with the OLS. With structural equation modelling it shows the highest regression weights on the OLS in Chile and Spain, probably for the same reason, and also on the HOL in Spain. Furthermore, item 5 is problematic with adolescents. Cronbach’s α would clearly increase if deleted. However, if item 3 is deleted all SE Models become unidentified, raising significant doubts about the suitability of using this scale with adolescents. • The PWI version with the item on satisfaction with groups you belong to (rather than the original item on satisfaction with community) shows the second best R² on the OLS. However, the PWI shows the lowest R² when regressed on the HOL. The PWI also displays more missing values in the four countries than the other two scales, probably due to the fact that it has more items. With structural equation modelling, a modified model of this scale shows much better fit statistics than the other two. However, it only shows the highest regression weights on the OLS in Brazil.
Some topics for discussion (V) …./… • The BMSLSS shows the lowest missing percentage values in two countries (Chile and Spain) and higher explained variance among adolescents than the PWI in the PCA. The original 5-item version only includes significant items when regressing on the OLS, but this is not the case for the version including an additional item. With structural equation modelling the original version shows the highest regression weights on the HOL in Brazil and Chile. This scale shows higher regression weights on the HOL than on the OLS in the 3 countries studied. • When including only the 3 latent variables referring to the 3 scales in the same SEM (Model 4, Figure 1), the lowest correlations appear to be between the PWI and BMSLSS, while the highest are between the SWLS and BMSLSS. This result seems to be counter-intuitive, suggesting that the SWLS and BMSLSS are measuring a very similar construct, while the PWI is measuring a rather different construct – conceptually, however, the PWI and BMSLSS are both measuring life domains, while the SWLS is a “context-free” scale, and therefore very different to the other two. Being context-free, it can somehow lie in between the two specific contexts posed by the remaining two scales, which may also contribute to the higher correlations.
Some topics for discussion (VI) • When expanding the first order model by including the OLS on the one hand or the HOL on the other, we encountered strong relationships between the single item and multi-item measures. • When age is added to our SE Models including the 3 scales together it becomes clear that well-being regularly decreases with age within this age range. This is less so in Chile, consistent with the fact that the age range studied for this country is more limited (14-16) than for Brazil and Spain (12-16). • Our results suggest that much research work must still be conducted. An initial consequence of our results is to recommend that future research for cross-country comparability collect data using more than one of the scales analyzed here, and with at least two single-item scales, one on overall life satisfaction and another one on happiness with overall life. We need much more data and from more countries to analyze in any real depth the qualities and possible weaknesses of each scale for the international comparison of adolescent populations.
Some topics for discussion (VII) • Secondly, the fact that the correlations among the 3 scales are high but not perfect means that the 3 scales are somehow complementary and their items can be considered as part of a broader scale including 3 major components, although some of the items share covariance. Some authors have even hypothesised that different psychometric scales measuring subjective well-being and other psychological positive constructs may belong to a same higher order construct (Stones & Kozma, 1985; Diener et al., 1999). However, it is important to take into account that when three first order factors are present, the first and second order models are equivalent and thus not testable against each other. We did try to fit the second order multiple group factor analysis model, but the estimates from Chile included a negative residual variance for the SWLS. Therefore, although the high correlations among dimensions seem to support the hypothesis of an existing supra-construct, further research will be required to explore this matter, ideally with four or more dimensions.
Acknowledgements • The Spanish research presented here has been funded by the Spanish Government’s Ministry of Science and Education, with reference number SEJ2007-62813/PS. • In Argentina the project was made possible by the support of the Cooperation Program between Argentina (MINCYT) and Brazil (CAPES) BR/08/18.
Subjective indicators of adolescents’ well-being. Comparing some results among four Latin-languages-speaking countries. Ferran Casas (Coord). http://www.udg.edu/eridiqv Spanish research team: Germà Coenders, Mònica González, Sara Malo, Irma Bertran & Cristina Figuer. Institut de Recerca sobre Qualitat de Vida. Universitat de Girona (UdG). Brazilian research team: Jorge C. Sarriera, Daniel Abs da Cruz, Lívia Bedin & Angela Paradiso. Instituto de Psicologia. Universidad Federal de Rio Grande do Sul (UFRGS). Chilean research team: Jaime Alfaro, Karin Weinreich & Boris Valdenegro. Escuela de Psicología, Facultad de Medicina, Universidad de Valparaíso, Chile. Argentinean research team: Enrique Saforcada & Schelica Elena Mozobancyk (Universidad de Buenos Aires – UBA). Graciela Tonón & Lia Rodríguez de la Vera (Universidad de La Matanza-ULM– & Universidad de Lomas de Zamora-ULZ). Research Institute on Quality of Life University of Girona