Download
1 / 12
120 likes | 233 Views
This presentation introduces the REDUCE method for identifying transcription factor binding sites in the human genome. Developed from earlier applications in yeast, this technique correlates expression data from 81 samples of human cerebral cortex stem cells with sequence data to reveal significant motifs. We discuss the pre-processing steps required for input data, the methodology for motif matching, and visualize our results through heatmaps indicative of correlating genes. Applications of our findings will also be highlighted, alongside conclusions drawn from the analysis.

E N D
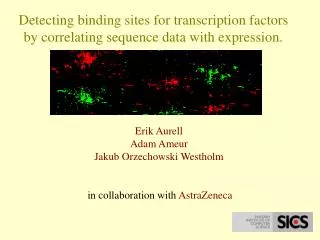
Detecting binding sites for transcription factors by correlating sequence data with expression. Erik Aurell Adam Ameur Jakub Orzechowski Westholm in collaboration with AstraZeneca
Ameur, Orzechowski 11/3 2003 Outline of the talk • Introduction • Data description • The REDUCE method • Results • Applications and Conclusions
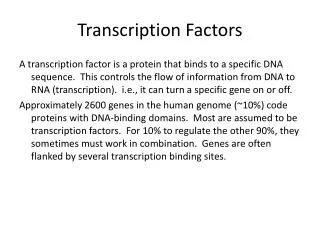
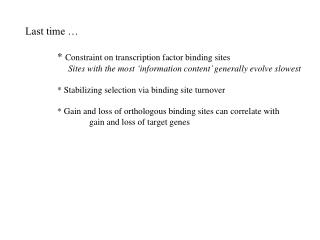
Ameur, Orzechowski 11/3 2003 Introduction - the REDUCE method • The aim is to find binding sites for transcription factors, motifs, in the human genome by using a method developed at Rockefeller University (Bussemaker, Li & Siggia 2001). • This method is called REDUCE and has previously only been applied to yeast data. We will apply it to human data. • The idea is to find motifs by correlating sequence and expression data. • Input consists of: Expression data, sequence data and a set of putative motifs. • Output is a list of significant motifs: consensus id description Dc2 F probes hits NNNRRCCAATSRGNNN M00287 NF-Y 0.0044 0.0661 1041 1279 NNNCGGCCATCTTGNCTSNW M00069 YY1 0.0014 0.0363 300 314 NNRACAGGTGYAN M00060 Sn 0.0013 -0.0345 368 374 NNNRGGNCAAAGKTCANNN M00134 HNF-4 0.0008 0.0290 263 272 TWTTTAATTGGTT M00424 NKX6-1 0.0007 -0.0234 428 457 KNNKNNTYGCGTGCMS M00235 AhR/Arnt 0.0006 -0.0254 155 161 NANCACGTGNNW M00123 c-Myc/Max 0.0006 -0.0243 50 50 NNBTNTNCTATTTNTT M00092 BR-CZ2 0.0005 0.0233 92 94 NNGAATATKCANNNN M00136 Oct-1 0.0005 -0.0230 213 244
Samples Genes Ameur, Orzechowski 11/3 2003 Expression data • Expression data is provided by AstraZeneca. It consists of 81 samples of human cerebral cortex stem cells undergoing various treatments. Expressions are measured on an Affymetrix u133 chip. • We visualize expression data in a heatmap. • It is possible to identify regions of correlated genes in the heatmap.
Ameur, Orzechowski 11/3 2003 Sequence data • In the REDUCE model, expression levels are explained by the number of times the motifs occur in the upstream sequences of human genes. • For this, sequences around the transcription starts are extracted. We take sequences in the range [1000 bp upstream, 100 bp downstream]. • Transcription starts and genome data are provided by AstraZeneca. • The upstream sequences are masked for repeats (with the program RepeatMasker). • Putative motifs are matched to the resulting sequences. • The motif TKAAA and its reverse complement TTTMA are matched in the example.
Ameur, Orzechowski 11/3 2003 Motifs • Motifs are represented as weight matrices : w(i,B) is the probability that base i is the nucleotide B in the motif M. • We generate the set of putative motifs as weight matrices. This can be done in several ways: • One possibility is to use the matrices (about 300) in the TransFac data base. • Another possibility is to generate matrices of our own, for example for all sequences of a certain length. Since the number of possible sequences grows exponentially with the length, this is only possible for sequneces up to length 7 or 8. • We have implemented a method based on Gibbs sampling to match weight matrices to upstream regions.
Ameur, Orzechowski 11/3 2003 Matching motifs to the upstream sequences • A weight matrix W is matched to a sequence s1 s2 … sn the following way: • For each of the bases s1 s2 … sn we extract the corresponding weight matrix entry w(i,si) and compute the following sum • Here bsiis the background frequence of base si. • An example: Assume we have the sequence AATCG and the matrix If all background frequencies are 0.25, this would give the score • The score is then compared to a threshold value:
Ameur, Orzechowski 11/3 2003 Pre-processing and REDUCE
Ameur, Orzechowski 11/3 2003 REDUCE output consensus id description Dc2 F probes hits NNNRRCCAATSRGNNN M00287 NF-Y 0.0044 0.0661 1041 1279 NNNCGGCCATCTTGNCTSNW M00069 YY1 0.0014 0.0363 300 314 NNRACAGGTGYAN M00060 Sn 0.0013 -0.0345 368 374 NNNRGGNCAAAGKTCANNN M00134 HNF-4 0.0008 0.0290 263 272 TWTTTAATTGGTT M00424 NKX6-1 0.0007 -0.0234 428 457 KNNKNNTYGCGTGCMS M00235 AhR/Arnt 0.0006 -0.0254 155 161 NANCACGTGNNW M00123 c-Myc/Max 0.0006 -0.0243 50 50 NNBTNTNCTATTTNTT M00092 BR-CZ2 0.0005 0.0233 92 94 NNGAATATKCANNNN M00136 Oct-1 0.0005 -0.0230 213 244 consensus- A consensus sequence for the motif. id - A unique id for each motif. description- The transcription factor name. Dc2- The significance of the motif. F - The effect. A positive value indicates activation and negative repression. probes - Number of probes with occurences of the motif in their upstream regions. hits - Total number of motif occurences.
Ameur, Orzechowski 11/3 2003 Visualizing REDUCE outdata • REDUCE outadata can be visualized in a heatmap. • The motifs in this heatmap are taken from TransFac. • Green dots indicate repressing and red dots indicate activating motifs. • The heatmap gives a clustering of samples on motifs.
Validation: The pictures below show the samples clustered on expression and on motifs. Samples clustered on motifs • Analysis of significant motifs: Samples clustered on expression data By analyzing the motifs found by REDUCE we hope to find motifs that explain clusters of correlated genes. For example, REDUCE found a TransFac motif in the samples associated with the red area in the picture. It matches 18% of the 109 genes in the picture, and 4% of the other genes. 109 of 9442 genes Samples • Finding new motifs: One iteration of REDUCE was run on all sequences of length 5. Motifs Samples Ameur, Orzechowski 11/3 2003 Analyzing REDUCE outdata
Conclusions • Our results on human data had somewhat lower significance than previuos results on yeast presented in (Bussemaker, Li & Siggia, 2001). There are several possible causes for this: • Data quality: Expression data, upstream regions. • Hard to validate findings. • Gene regulation probably more complicated in human. • Even so, our results suggest that the REDUCE method might give useful information about transcription factor binding sites in humans. Probably, this requires prior knowledge about motifs and other methods such as clustering. Ameur, Orzechowski 11/3 2003 Applications • Identify coregulated genes with potentially different expression profiles, using the motifs found by REDUCE. • Predict previously unknown motifs, or new properties of known ones.