Population Sampling Methods in Wildlife Research: A Comprehensive Overview
Explore the application of capture-recapture methods like the Peterson and Schnabel methods in estimating wildlife populations. Discover how these techniques are utilized in studying Yellowstone Grizzlies, from den excavations to sensor placement. Learn about life tables and reproductive values for understanding population dynamics.

Population Sampling Methods in Wildlife Research: A Comprehensive Overview
E N D
Presentation Transcript
Population Sampling • Problems • Where is the population? Does it have borders? • How much do you sample for population estimate? • Some estimates indicate that as much as 50% of the population needs to be captured at some time.
Live Census • Capture-Recapture (Peterson method)
Assumptions • Assumptions of the Petersen Method • Population is closed, so N is constant (no immigration or emigration) • All animals have equal chance of getting caught in first sample • Marking individuals doesn’t affect catchability (not trap shy or trap happy) • Marks are not lost between sampling periods • Marks are reported on discovery in second sample
Schnabel Method • Series of samples, marking each time • Ct = Rt + Ut • Ct = Total # of individuals caught in sample t • Rt = # of individuals already marked when caught in sample t • Ut = # individuals marked for 1st time & released in sample t
Life span Adults can live approximately 25 years.
Average age composition: Cubs 19% Yearlings 13% 2 yr. olds 11% 3-4 yr. olds 13% Adults 14%
Den Excavated - don’t use natural shelters About 5 X 4 X 8 feet Entrance normally faces north Entered in snowstorm - usually late November
Data • Information is taken for heart and other physiological data
Weight is taken • Sex recorded
Aging • Teeth impressions • Molar extraction
Tag Application • Ear tag • Lanyards
Bear taken to more remote area • Often returned
Den • Tracking to Den • Data taken including temperature
Satellite Data Recording • Data for den temperature and bear body temperature are recorded daily
Sensor Placement • Temperature and light sensors • In den • On bear • Outside den
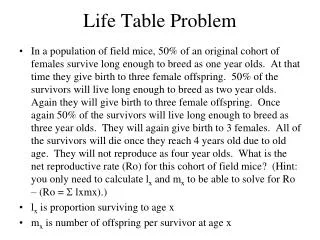
Life Tables • Survivorship Data • Follow population over time • Census population • Death Data
Combination • Average of many years’ census • (Combines static tables)
Reproductive value The average contribution to the next generation that members of a given age group in a population give between their current age and death.
Reproductive value • Reproductive value at an individual age OR
Reproductive value Sum of current output and future possibilities taking survival into account Female gray squirrels Phlox drummondii