Download
1 / 26
260 likes | 415 Views
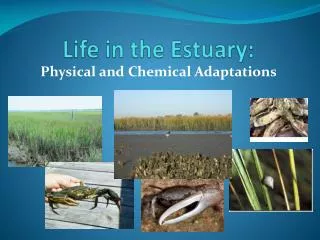
Project Level Effectiveness Monitoring in the Estuary and Response in Fish Communities. Who is CREST?. Council of Governments (b. 1974)

E N D
Project Level Effectiveness Monitoring in the Estuary and Response in Fish Communities
Who is CREST? Council of Governments (b. 1974) Members: Port of Astoria, Wahkiakum Port Dist. #2, Port of Peninsula, Port of Ilwaco, City of Seaside, City of Warrenton, City of Astoria, City of Gearhart, City of Ilwaco, Clatsop County, Wahkiakum County, Clatsop Soil & Water Dist., City of Cannon Beach
CREST DEPARTMENTS: 1. Coastal/Estuarine Planning 2. Habitat Restoration 3. Ecosystem Monitoring Project Types: -dike breach -riparian enhancement -stream realignment -culvert/bridge replacement -in-stream enhancements
Fish Community Parameters Species Abundance Length Weight Additional Parameters Genetics Prey Availability* Prey Utilization* Residence Time *lab analyses at AHS Tributary & Mainstem Baseline Seining Restoration & Reference Site Fyke Net Trap Insect Fallout Traps & Gastric Lavage
Habitat Parameters Water Quality Vegetation Sediment Accretion Hydrology (channel formation) Sampling Design Before & After Comparison to baseline Comparison to reference sites
Coordinated Regional Effort AEM for individual restoration projects (EP Coordination, BPA funding) • NOAA Fisheries (multiple sites) • CREST, Columbia Land Trust , Scappoose Bay Watershed Council. Ash Creek Forest Management, Parametrix Cumulative Effects Study (USACE funding) • Measuring hydrology, channel morphology, vegetation, fish presence and community structure, and flux of nutrients and organic matter • Developing monitoring protocols (Roegner et al. 2008) • Reference Site Study (EP & PNNL Coordination, BPA funding) • Measuring hydrology, channel morphology, vegetation, elevation profiles, and sediment accretion • Coordination to ensure: • Data are comparable across sites and time for similar types of actions and habitats • Results are scalable
Spring 2008: Selection of Pilot AEM Sites(EP Science Workgroup, BPA funding) Developed a list of sites: Multi year restoration projects had occurred Some baseline monitoring was conducted Number of potential sites = 12 Intensive versus Extensive Selected 4 sites representing project diversity Different river reaches, habitat types, and restoration strategies Solicited feedback on sites from scientific working groups
Fort Clatsop • Brackish freshwater wetland • Culvert replacement with bridge • Scappoose Bottomlands • Emergent wetland • Revegetation, Cattle exclusion • Mirror Lake • Bottomland riparian forest • LWD, Culvert enhancement, Revegetation • Sandy River Delta • Floodplain forest • Revegetation
Extensive diking for flood control and agriculture • Dredging and removal of woody • debris to fill lands and aid navigation • Pesticide and fertilizer use • Runoff and sedimentation from logging operations and road building • Encroaching development • Erosion & poor riparian cover Watershed Context Otter Point Dike Breach Lewis & Clark River South Slough Bridge Install Seaside Dike Breach II Seaside Dike Breach I
Fort Clatsop’s South Slough -Restore tidal processes -Reconnect 50 acres of historic off-channel rearing habitat -Minimize risk to County Rd.
South Slough Salmonid Abundance South Slough Pre-construction (2007) Post-Construction (2009) Post-Construction (2008) Reference Site (2009)
Salmonid Average Lengths 2008 * Indicates individual length measurement
Juvenile salmon occupy restoration sites in accordance with their life histories; similar abundances in restored marshes compared to mainstem tributaries. Juvenile salmon are utilizing the dominant prey types available in the site. Recruitment & migration corridor factors, as well as site maturity, may control variability in fish populations. Site Specific Lessons:
Meta-Analysis of Data for Monitoring Programs Literature Search Contact restoration & monitoring partners for data Identify sites with comparable restoration actions & pre/post data Compile data on select metrics Select analyses methods and apply Preliminary meta-analysis metrics: Water temperature Sediment accretion rate Juvenile salmon presence/absence Photo points
Restoration Site Effectiveness Data Monitoring Sites Reference Sites Restored Sites Performance (Report Cards) Lesson Learned (Meta Analysis) Program Report Card Stakeholders Report New Science Cumulative Effects Research Project RFP Project Proposals Proposed Project Prioritization Analysis Restoration Strategy New Projects
Meta-Analysis Sites Kandoll Farm Johnson Property Crims Is. Vera Slough Ft. Clatsop 5 sites chosen Tidal reconnection projects (dike breach, culvert & tide gate replacements) Restoration actions between 1999-2008
Data Available *Used in preliminary meta-analysis
Vegetation Photo Points: South Slough Post Pre Pre Post
Water Temp: South Slough Result: Water temperatures were lower post restoration
Sediment Accretion Rates Sediment Accretion Rates (cm y-1) at Paired Restoration & Reference Sites [1] Measurements taken September 2006 and February 2007 [2] Measurement taken July 24, 2008 (restoration) 8/15/08 (reference). [3] Measurements taken 2005 and 2007. [4] Measurements taken 2005 and 2007.
Salmon Presence 4 of 5 sites demonstrated increased fish presence post project implementation Vera Slough outside of migratory pathway?
Summary--Is the response variable trending in the desired direction?
Take Home Message Long-term monitoring data is invaluable Variability in level of effort / metrics between sites limit analyses Pre/post project implementation bare minimum >10 year per site preferable to get long-term trajectory Include report cards lists project objectives and expected outcomes monitoring data results then document whether objectives were met Restored sites are responding measurably to restoration actions on individual site scale Differences in response among sites, for example temperature and accretion rates, can likely be explained by differences in geomorphology, elevation and location Important considerations in assessing cumulative effects on large scale How much is enough…and where should we focus our limited resources for biggest uplift are difficult questions
Thank you! Contacts for More Information: Micah Russell (503) 325-0345 ext 18, mrussell@columbiaestuary.org Catherine Corbett (503) 226-1565 ext 240, corbett@lcrep.org Heida L. Diefenderfer (360) 681-3619, Heida.Diefenderfer@pnl.gov Blaine D. Ebberts (503) 417-7567, blaine.d.ebberts@usace.army.mil Gary E. Johnson (503) 417-7567, Gary.Johnson@pnl.gov Krista L. Jones (503) 226-1565 ext 239, jones@lcrep.org Ian Sinks (360) 696-0131, isinks@columbialandtrust.org