Download
1 / 24
250 likes | 349 Views
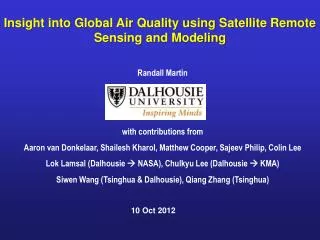
Using Satellite Remote Sensing to Estimate Global Outdoor Air Pollution Exposure. Randall Martin, Dalhousie and Harvard-Smithsonian Aaron van Donkelaar, Dalhousie University Lok Lamsal, Dalhousie University NASA Goddard.

E N D
Using Satellite Remote Sensing to Estimate Global Outdoor Air Pollution Exposure Randall Martin, Dalhousie and Harvard-Smithsonian Aaron van Donkelaar, Dalhousie University Lok Lamsal, Dalhousie University NASA Goddard Workshop on Space Technology for Public Health Actions in the Context of Climate Change Adaptation 20 June 2011
Large Health Effects of Fine Particulate Matter (PM2.5) Long-term exposure to urban outdoor PM2.5 causes 800,000 deaths/yr (Cohen et al., 2004) ~ 1 year increase of life expectancy for decreasing long-term exposure of PM2.5 by 10 ug/m3 (e.g. moving from Southeast US to most of Canada) Regulation of fine particulate matter achieved the largest estimated benefits of all U.S. Federal Regulations
Large Regions Have Insufficient Measurements for Air Pollution Exposure Assessment Locations of Publicly-Available Long-Term PM2.5 Monitoring Sites Monitor locations can be driven by compliance objectives ~1 site / 10,000 km2 in continental US & southern Canada Lee et al., ACPD, 2011
Column Observations of Aerosol and NO2 Strongly Influenced by Boundary Layer Concentrations Weak Thermal Contrast Strong Rayleigh Scattering Aerosol O3 NO2 O3 9.6 2.2 4.7 0.52 0.62 0.75 0.30 0.36 0.43 Wavelength (μm) Vertical Profile Affects Boundary-Layer Information in Satellite Obs Normalized GEOS-Chem Summer Mean Profiles over North America O3 Aerosol Extinction S(z) = shape factor C(z) = concentration Ω = column NO2 Martin, AE, 2008
Aerosol Remote Sensing: Analogy with Visibility Effects of Aerosol Loading Waterton Lakes/ Glacier National Park Pollution haze over East Coast 7.6 ug m-3 22 ug m-3
Combined Aerosol Optical Depth (AOD)from MODIS and MISR Instruments for 2001-2006 Combined MODIS/MISR r = 0.63(vs. in-situ PM2.5) van Donkelaar et al., EHP, 2010
Calculate AOD/PM2.5 with Chemical Transport Model (GEOS-Chem) Simulation Aaron van Donkelaar
Significant Agreement with Coincident In situ Measurements Annual Mean PM2.5 [μg/m3] (2001-2006) Satellite Derived Satellite-Derived [μg/m3] In-situ In-situ PM2.5 [μg/m3] van Donkelaar et al., EHP, 2010
Global Climatology (2001-2006) of PM2.5 Evaluation with measurements outside Canada/US Better than in situ vs model (GEOS-Chem): r=0.52-0.62, slope = 0.63 – 0.71 van Donkelaar et al., EHP, 2010
Error in Satellite-Derived PM2.5 has Three Primary Sources Satellite-derived PM2.5 =η·AOD Satellite • Error of 0.1 + 20% vs independent observations • Implication for satellite PM2.5 determined by η • Model • Affected by aerosol optical properties, concentrations, vertical profile, relative humidity • Most sensitive to vertical profile [van Donkelaar et al., 2006] Sampling Biases Satellite retrievals are at specific time of day for cloud-free conditions
Model (GC) CALIPSO (CAL) Evaluate Simulated (GEOS-Chem) Vertical Profile with Satellite (CALIPSO) Observations Altitude [km] • Coincidently sample model and CALIPSO extinction profiles • Jun-Dec 2006 • Compare % within boundary layer Optical depth above altitude z Total column optical depth τa(z)/τa(z=0)
Error Estimate Satellite-Derived [μg/m3] • Estimate error from bias in profile and AOD ±(1 μg/m3 + 15%) • Contains 68% (1 SD) of North American data • Total uncertainty 25% (with sampling) • Global population-weighted mean uncertainty 7 μg/m3 In-situ PM2.5 [μg/m3] van Donkelaar et al., EHP, 2010
WHO Guideline & Interim Targets Long-term Exposure to Outdoor Ambient PM2.5 AQG IT-3 IT-2 IT-1 100 90 80 70 60 50 40 30 20 10 0 • 80% of global population exceeds WHO guideline of 10 μg/m3 • 35% of East Asia exposed to >50 μg/m3 in annual mean • ~1 year life expectancy lost for 10 μg/m3 • Estimate health effects of PM2.5 exposure Population [%] 5 10 15 25 35 50 100 PM2.5 Exposure [μg/m3] van Donkelaar et al., EHP, 2010
Emerging Applications Estimate global burden of disease (WHO) attributable to air pollution (Cohen et al. in prep) Significant association of PM2.5 and health at low PM2.5 levels (Crouse et al., EHP, in prep) Satellite dataset dominant contributor to national PM2.5 model (Hystad et al., EHP, in press) Estimate global mortality from PM2.5 (Evans et al. in prep) Air pollution and adverse birth outcomes: An international analysis of WHO Global Survey on Maternal and Perinatal Health (Fleischer et al., ISEE, 2011) Cigarette smoking is a negative confounder in epidemiological studies of long-term ambient air pollution and mortality outcomes in Canada (Villeneuve et al., OEM, 2011)
USA Today: Hundreds Dead from Heat, Smog, Wildfires in Moscow 9 Aug 2010: “Deaths in Moscow have doubled to an average of 700 people a day as the Russian capital is engulfed by poisonous smog from wildfires and a sweltering heat wave, a top health official said Monday.” MODIS/Aqua: 7 Aug 2010
Spatial and Temporal Variation in Satellite-Based PM2.5 during Moscow 2010 Fires van Donkelaar et al., AE, submitted
Application of Satellite-based Estimates to Moscow Smoke Event During Fires Before Fires r2 =0.85, slope=1.06 MODIS-based In Situ PM2.5 from PM10 In Situ PM2.5 van Donkelaar et al., submitted
In Situ GEOS-Chem General Approach to Estimate Surface NO2 Concentration Method: Solar backscatter NO2 Column Coincident ModelProfile l1 l2 Scattering by Earth surface and atmosphere Idealized NO2 absorption spectrum • S→ Surface Concentration • Ω → Tropospheric column l1 l2
Ground-Level Afternoon NO2 Inferred From OMI for 2005 Spatial Correlation vs In Situ for North America = 0.78 Lok Lamsal
Challenges Encouraging Prospects for Satellite Remote Sensing to Inform Air Pollution Exposure Remote Sensing: Improved algorithms to increase accuracy, resolution, and observe other pollutants Modeling: Develop representation of processes Measurements: More needed for evaluation Health Applications: Close interaction to develop appropriate applications Acknowledgements: Health Canada NSERC NASA