Download
1 / 15
150 likes | 266 Views
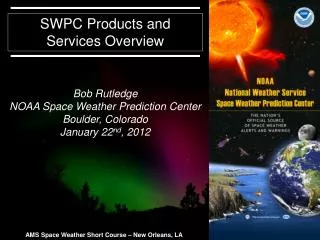
Relationship between SWPC Products and Geoelectric Fields. Outline Motivation & Background Initial Results Direction for the future. Christopher Balch – SWPC Jenn Gannon- USGS Space Weather Workshop Boulder, CO 16 April 2013. E-field motiviation.

E N D
Relationship between SWPC Products and Geoelectric Fields • Outline • Motivation & Background • Initial Results • Direction for the future Christopher Balch – SWPC Jenn Gannon- USGSSpace Weather Workshop Boulder, CO 16 April 2013
E-field motiviation Electric Utilities Workshop 2011 requests ‘…real-time specification and prediction of the electric field at user operating site’ ‘…due to limitations in prediction, predictive summary measures will likely be required for the near term’ ‘…SWPC & partners will investigate a storm catalog to find ways to characterize the envelope of these disturbances’ Note – current product suite uses global Kp index
Electric Field Calculation: Partnership with USGS • Requires Magnetometer Data • Requires Earth Conductivity • Highlights GIC as a geo-hazard as well as a space wx hazard • Calculation of historical E-field by USGS & NRCAN(Gannon talk – this session) • Able to specify E-field distribution as a function of Kp • Able to look at storms from the perspective of the E-field magnitude, duration, envelope • Points the direction for future product development Credit: Fernberg, Gannon and Bedrosian,
Probabilities to exceed Et levels BOUprobabilities FRD probabilities
Future – storm analysis • Characterize the Et time series • Rank storms by electric field intensity, duration, other measures TBD • Construct storm catalog for reference ‘Bastille Day’ storm of July 2000: Et, Bx, By, Kp
Future: USGS-NOAA Operational Local Geo-electric Field Product • Driven by USGS real-time magnetometer data • Electric field calculated locally using regional 1D conductivity • User would be able to view calculated E-field time series anywhere on the map
Future: E field Forecasting? • Critical dependence on ACE solar wind data (DSCOVR) • Efforts continue to select and transition a GEOSPACE model to support regional predictions • Development effort will have to address limits of model time & spatial resolution Ovation - Aurora Solar Influences on GeospacePredicted with Geospace Models using Solar Wind Input
Summary • 1D region conductivity models have been developed (USGS) • 25 years of historical E-field calculations have been completed (USGS, NRCAN) • Analysis of the data is underway • Comparisons between Kp & Et • Et distribution varies with Kp • Distributions are very dependent on location • Kp contains probabilistic information about Et • Future Products • Storm analysis/catalog from E field perspective • Nowcast E field maps are in development • Forecast E field products are TBD