Download
1 / 28
290 likes | 585 Views
Event Detection in Wireless Sensor Networks. Christopher Leckie National ICT Australia Department of Computing and Information Systems The University of Melbourne www.csse.unimelb.edu.au/~caleckie. Wireless Sensor Networks. Wireless nodes for remote monitoring and control

E N D
Event Detection in Wireless Sensor Networks Christopher Leckie National ICT Australia Department of Computing and Information Systems The University of Melbourne www.csse.unimelb.edu.au/~caleckie
Wireless Sensor Networks • Wireless nodes for remote monitoring and control • Self-configuring multi-hop network • Limited • Power (Battery) • Bandwidth • Memory • Computation capability • Heterogeneous nodes with varying capabilities http://www.sensortaiwan.com/asptest/Prd_Wireless.asp
WSN – Example applications • Water distribution monitoring • Public health and safety • Critical infrastructure monitoring • Environmental monitoring • Great Barrier Reef, Australia http://www.coralreefeon.org/sensor networking the Great Bar-rier Reefa.pdf. http://wallpaper.digiocto.com/O,water/,R. Szewczyk, E. Osterweil, J. Polastre, M. Hamilton, A. Mainwaring, and D. Estrin. Habitat monitoring with sensor networks. In CACM, vol 47, pg 34–40, June 2004, Courtesy: Stuart Kininmonth, AIMS
WSN – Topologies • Clustered, hierarchical Gateway node
Monitoring environment • Monitoring a heterogeneous environment • Data distribution is unknowna priori • Each sensor node si • Measures a feature vector xi comprisingmultiple attributes or features vj j = 1…d • e.g., temperature, pressure, humidity • Measurements collected as a continuous data stream
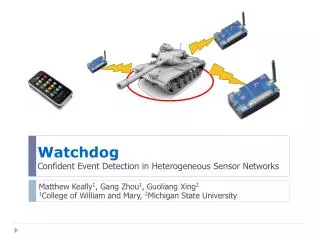
WSN Security Considerations • Sensor nodes are not tamper-resistant • Wireless communication infrastructure is susceptible to eavesdropping, data injection, data modification and replay attacks • Capturing and subverting legitimate nodes is possible • The adversary can easily deploy malicious nodes which may collude to attack the system
WSN Security Threats Physical – Tampering, capture and subversion Link Layer – Jamming, contention, exhaustion Network Layer – Flooding, traffic redirection, spoofing, packet dropping, homing Application Layer – Eavesdropping, replay, data insertion, data modification
Challenges for Managing WSNs S8 Detecting malicious nodes S6 S7 S1 S2 S3 S4 S5 Detecting abnormal measurements Detecting faulty nodes
Unusual events in sensor measurements Observations that are inconsistent with the remainder of the data set (anomalies) • Causes of anomalies • Sudden change in the environment • Faulty nodes (loss of calibration) • Malicious attacks (data injection) • Noise • Identifying anomalies • Analyse measurement ortraffic data in the network • Build model of normal behavior to classify anomalies S. Rajasegarar, C. Leckie and M. Palaniswami. Anomaly Detection in Wireless Sensor Networks. In IEEE Wireless Communications, vol. 15, no. 4, pp. 34-40, August 2008.
Centralised approach • All data are routed to gateway node • Anomaly detection performed at the gateway node Anomaly detection Gateway node S8 S6 S7 S1 S2 S3 S4 S5
Centralised anomaly detection methods • Distance based outliers : A data point is an outlier if at least a given fraction of the data points lies further than a given distance [Knorr,98] • Kth nearest neighbour[Ramaswamy, 00],[Eskin,02] • Cluster based outliers[He, 03], [Chan, 05] • Data points in a low density region[Kollios, 03] • Using hyperplane in a higher dimensional space to separate outliers [Eskin, 02]
Issues with Centralised Approach • Large amount of energy consumed in communication • Nodes near the gateway node become a bottleneck • Imbalanced load distribution in the network • Reduced lifetime of network • Scalability Need for a distributed approach
Anomaly detection S1 Merging S2 S3 S4 S5 S6 S7 Estimation of data distribution Distributed approach • Estimation of distributionof local measurements • Summary statistics from each node are communicated to parents • Merging • Similar distributions from children are identified and merged • Anomaly detection algorithm applied at gateway Gateway node Summary statistics
Previous work • Probability density based approaches [Palpanas, 03], [Klush, 03], [Kerigel, 05] • Density estimation of local data. • Transmitting the estimates to the parent nodes and finding a global estimate. • Communicating back to the local nodes to classify the data. • Distributed clustering based on k-means algorithm for peer-to-peer environment [Bandyopadhyay, 04] • Multiple message passing in the network. Bandwidth is not the primary concern.
Challenges in monitoring WSNs • Low cost sensors and nodes are prone to faults • Erroneous readings can contaminate data • Reporting all measurements for analysis • Drains energy • Shortens network lifetime How to detect unusual events in sensor networks? Distributed learning with communication constraints
S2 S1 Roadmap of research • Local anomalies • Detecting anomalies that occur with respect to data at a single node • Global anomalies • Detecting nodes whose data is anomalous with respect to other nodes • Modelling complex events • Detecting unusual events that span different time scales and spatial scales S3 S1 S2
Building hyper-ellipsoidal models Computationally efficient representation of raw data Batch learning Random vector with sample mean and covariance Construct level set of all vectors that have same Mahalanobis distance to the mean: Rajasegarar, S., Bezdek, J. C., Leckie, C. and Palaniswami, M. (2009). “Elliptical Anomalies in Wireless Sensor Networks,” ACM Transactions on Sensor Networks, 6(1), 1550-1579.
Hyper-ellipsoidal clustering algorithm • Require an efficient clustering algorithm that can run on a sensor node: • automatic selection of the number of clusters • low computational cost (O(N)) • explicit cluster boundary detection M. Moshtaghi, S.Rajasegarar, C. Leckie, S. Karunasekera, "An Efficient Hyperellipsoidal Clustering Algorithm for Resource-Constrained Environments", Pattern Recognition, Volume 44, Issue 9, Sept. 2011
Incremental learning As the number of observed samples increases,the effects of the new samples becomes small. Need to find a way to gracefully degrade the influence of inputs collected in the (distant) past. M. Moshtaghi, C. Leckie, S. Karunasekera, J. Bezdek, S. Rajasegarar, and M. Palaniswami, "Incremental Elliptical Boundary Estimation for Anomaly Detection in Wireless Sensor Networks," IEEE International Conference on Data Mining (ICDM 2011), December 2011
S2 S1 Roadmap of research • Local anomalies • Detecting anomalies that occur with respect to data at a single node • Global anomalies • Detecting nodes whose data is anomalous with respect to other nodes • Modelling complex events • Detecting unusual events that span different time scales and spatial scales S3 S1 S2
S1 S2 S3 S4 S5 S6 S7 Elliptical anomalies – Distributed approach • Estimation of distributionof local measurements • Summary statistics from each node are communicated to parents • Global ellipsoids determined at gateway Gateway node Local ellipse information Global ellipse information We require a distance or similarity measure to identify candidate hyper-ellipsoids for merging
Distance Measure for Hyper-ellipsoids Advantages: • Satisfies distance pseudometric properties • Incorporates shape and physical distance • If data is replaced by ellipsoids, we need to be able to compare the ellipsoids • Focal Distance Measure D(E1, E2) = mean(F12, F22, F11, F21) F12 F11 F21 F22 E2 E1 M. Moshtaghi, T. Havens, J. Bezdek, L. Park, C. Leckie, S. Rajasegarar, J. Keller and M. Palaniswami, "Clustering ellipses for anomaly detection", Pattern Recognition, Vol. 44, Issue 1, Jan. 2011
Global Anomalies S3 S1 S2 Use hyper-ellipsoidal distance measure to identify globally anomalous sensors
S2 S1 Roadmap of research • Local anomalies • Detecting anomalies that occur with respect to data at a single node • Global anomalies • Detecting nodes whose data is anomalous with respect to other nodes • Modelling complex events • Detecting unusual events that span different time scales and spatial scales S3 S1 S2
Future work – learning complex events Illustrative example – upwelling events on Great Barrier Reef
Future work – learning complex events Aim: model and detect elaborate activities in complex sensing environments Complex activities and trends Localised activities Inferred events Sensor data streams
Future work – learning complex events • How to learn multiple layers of abstraction spanning multiple time scales and spatial scales? • How can deep learning algorithms be used to learn activity and event models from heterogeneous sensor data? • How can deep learning algorithms be distributed for in-network processing in sensor networks? • What bounds can be derived on the communication overhead and approximation error in distributed and incremental learning compared to centralised approaches?