Gene Expression Modulation in Human Immune Cells by E2 and 4-NP Treatment
This study investigates the gene expression changes in U937 human immune cells following treatment with 5 µM estrogen (E2) and 4-nonylphenol (4-NP) over 48 hours. Using DNA microarray analysis, significant alterations were observed, with genes involved in estrogen signaling showing at least 2-fold regulation. Figures include scatter plots, normalized heat maps, and RT-PCR analysis of ESR2 expression, confirming the microarray data. The findings indicate potential negative modulation of estrogen receptor beta activity by both E2 and 4-NP, highlighting their biological impact.

Gene Expression Modulation in Human Immune Cells by E2 and 4-NP Treatment
E N D
Presentation Transcript
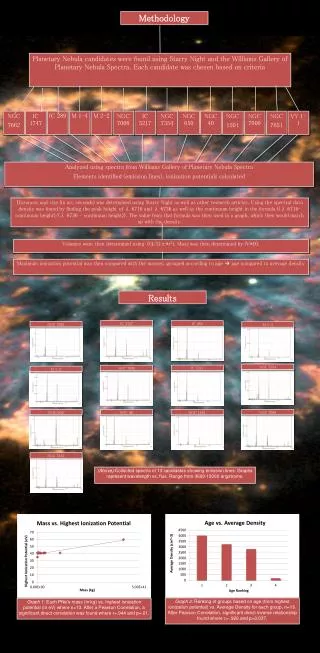
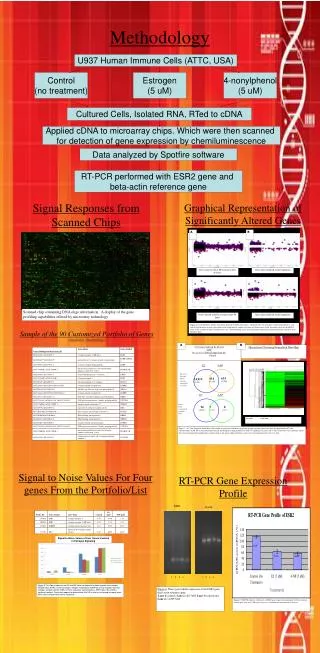
A B Genes altered with 4-NP treatment after 48 hours Genes that exhibited 2-fold regulation Signal-to-Noise Values of Four Genes Involved in Estrogen Signaling Genes altered with E2 treatment after 48 hours Genes that exhibited 2-fold regulation Figure 2: (A) Scatterplots of gene expression analyzed by DNA microarray. The probe ID’s for each gene is represented by the x-axis and the fold changes in gene expression for the experimental samples based on the fluorescence-based detection signals of the mRNA levels in the control are represented by the y-axis. (B) Remaining genes after filtering by modulation and normalization with the b-actin reference gene. A B • # Of Genes Induced By E2 and • 4-NP • by a > or = 2-Fold Change from the • Control Hierarchical Clustering Normalized Heat Map E2 4-NP All genes from the whole- genome nanochips (33,155) 633 (1.9%) 414 (1.2%) 14,913 (45.0%) E2 4-NP Genes from customized portfolio (90) 54 (60.0%) 8 (8.9%) 7 (7.8%) E2 (5uM) 4-NP (5uM) Figure 3: (A) Venn Diagram which shows the number of genes that exhibited significant changes in gene expression after the application of E2 and concentrations of NP. (B) A normalized hierarchical clustering heat map performed in order to similarities of genes and to what extent they were affected. Genes that were downregulated significantly are illustrated by the green while red denotes genes that were upregulated by at least 2-fold. Scanned chip containing DNA oligo information. A display of the gene profiling capabilities offered by microarray technology RT-PCR Gene Expression Profile ESR2 β-actin n=4 n=4 n=4 1 2 3 4 1 2 3 4 Figure 6: These gels exhibit expression of the ESR2 gene the β-actin reference gene. Lane 1=control, Lane 2 =E2 5uM, Lane 3=control and Lane 4 = 4-NP 5uM. Figure 7: RT-PCR Analysis of Intensity of ESR2 gene expression normalized with the internal control gene beta-actin. This data serves as a validation for the microarray analysis. Methodology U937 Human Immune Cells (ATTC, USA) Estrogen (5 uM) Control (no treatment) 4-nonylphenol (5 uM) Cultured Cells, Isolated RNA, RTed to cDNA Applied cDNA to microarray chips. Which were then scanned for detection of gene expression by chemiluminescence Data analyzed by Spotfire software RT-PCR performed with ESR2 gene and beta-actin reference gene Signal Responses from Scanned Chips Graphical Representation of Significantly Altered Genes Sample of the 90 Customized Portfolio of Genes (GeneEntrez, GeneOntology) Signal to Noise Values For Four genes From the Portfolio/List Figure 5: This figure indicates that E2 and NP have the potential to down regulate the estrogen receptor beta (ESR1) and the estrogen receptor related beta (ESRR-β) and up regulate repressor estrogen receptor activity (REA) (at their respective concentrations). ESR1 does not exhibit a significant pattern. These data appear to demonstrate that NP as well as enhanced estrogen levels diminishes estrogen beta activity negatively.