Gene Expression Profile of ERβ in U937 Human Immune Cells Treated with Estrogen and 4-NP
This study investigates the mRNA expression levels of the estrogen receptor beta (ERβ) in U937 human immune cells using RT-PCR analysis. Cells were treated with 5 µM of either estrogen or 4-nonylphenol (4-NP), and a control group was included. Gene expression profiles were analyzed via cDNA microarray, revealing significant alterations in gene expression. The results indicated various genes were differentially expressed, highlighting the potential impacts of estrogen and 4-NP on immune cell signaling pathways associated with breast cancer initiation.


Gene Expression Profile of ERβ in U937 Human Immune Cells Treated with Estrogen and 4-NP
E N D
Presentation Transcript
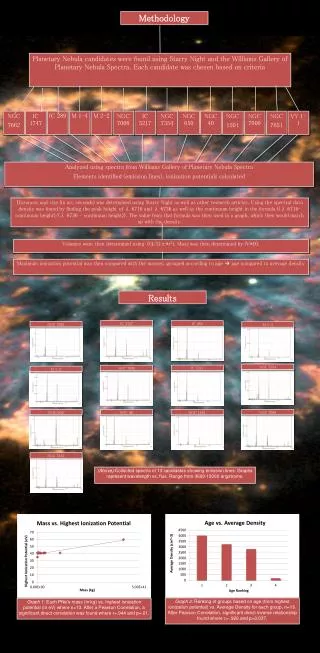
RT-PCR Gene Profile of ERβ 140 120 100 80 60 mRNA/B-actin mRNA (%) 40 20 0 Control (No E2 (5 uM) 4-NP (5 uM) Treatment) Treatments Methodology U937 Human Immune Cells Control (No treatment) (n=4) Estrogen (5 uM) (n=4) 4-nonylphenol (5 uM) (n=4) Cultured Cells, RNA Isolation, RT (to cDNA) Applied cDNA to microarray chips Scanned chips for detection of gene expression by chemiluminescence Data analyzed by Spotfire software RT-PCR (using ER-beta) Reference gene: B-actin 2% agarose gel electrophoresis Spotfire Graphical Representation of Significantly Altered Genes Comparison of Altered Genes (By at least 2-Fold from Control) 4-NP Estrogen B A E1 14,913 (43.4%) 414 (2.6%) 633 (4.0%) All genes from the whole- genome nanochips (15,960/33,155) Total Genes altered by 4-NP Total Genes altered by estrogen 4-NP C D Estrogen D E2 54 (78.3%) 8 (11.6%) 7 (10.1%) Genes from customized portfolio (69/90) Significantly altered genes by 4-NP Significantly altered genes by estrogen A/B) Scatterplots that represent Total gene expression analyzed by DNA microarray. The gene ID is represented by the x-axis and the fold change in gene expression are represented by the y-axis. (C/D) Scatterplots represent Only the significantly altered genes exhibiting at least a 2-fold-change from control. The x-axis represents the gene ID and the y-axis represents fold change in gene expression. (E1) Venn Diagram shows the numerical comparison of the total genes altered by 4-NP and estrogen as depicted in Figure A/B. (E2) Venn Diagram shows numerical representations of the gene expression of only the 90 portfolio genes. Portfolio genes include a total of 90 genes involved in estrogen signaling and breast cancer initiation. Signal-to-Noise Values of Four Genes Involved in Estrogen Signaling F1 F2 ERα ERβ ERRβ (F1) 4-NP and estrogen have the potential to down regulate the estrogen receptor beta (ERβ) and the estrogen receptor related beta (ESRR-β) and up regulate repressor estrogen receptor activity (REA). ERα does not exhibit a significant pattern. (F2) Chart depicting numerical values for up/down regulation of gene after treatment. ERβ gene was used towards RT-PCR validation step. RT-PCR Gene Expression Profile Statistical Significance β-actin ERβ G3 G1 G2 (G1) ERβ gene expression. Lane 1=control, Lane 2 =E2 5uM, Lane 3=control and Lane 4 = 4-NP 5uM. (G2) β-actin reference gene expression. Lane 1=control, Lane 2 =E2 5uM, Lane 3=control and Lane 4 = 4-NP 5uM. (G3) Graphical representation of RT-PCR Analysis of Intensity of ERβ gene expression normalized with the internal control gene β-actin. This step serves as a validation for the microarray data. n=4 n=4 n=4 1 2 3 4 1 2 3 4