Contagion Processes in Complex Networks
340 likes | 529 Views
Contagion Processes in Complex Networks. Michelle Girvan University of Maryland. Protein Interaction Networks. Jeong, H., Mason, S., Barabasi, A.-L. & Oltvai, Z. N., ”Lethality and centrality in protein networks”, Nature, 411, pp 41, 2001.

Contagion Processes in Complex Networks
E N D
Presentation Transcript
Contagion Processes in Complex Networks Michelle Girvan University of Maryland
Protein Interaction Networks Jeong, H., Mason, S., Barabasi, A.-L. & Oltvai, Z. N., ”Lethality and centrality in protein networks”, Nature, 411, pp 41, 2001. Wagner, A, “How large protein interaction networks evolve.”Proc. R. Soc. Lond. B 270, 2003. 457-466
Human Sexual Contacts The structure and function of complex networks, M. E. J. Newman, SIAM Review 45, 167-256 (2003)
Contagion of TB Courtesy of Valdis Krebs, orgnet.com
Status Communication Network Flack JC, Girvan M, de Waal FBM, Krakauer DC. 2006. Policing stabilizes construction of social niches in primates. Nature 439:426-429.
Traditional vs. Complex Systems Approaches to Networks Traditional Questions: Social Networks: Who is the most important person in the network? Graph Theory: Does there exist a cycle through the network that uses each edge exactly once? Complex Systems Questions: What fraction of edges have to be removed to disconnect the graph? What kinds of structures emerge from simple growth rules?
Areas of Network Research Structural Complexity • The wiring diagram could be an intricate tangle, far from perfectly regular or perfectly random. Example: community structure • The network could include different classes of nodes • The edges could be heterogeneous with different weights, directions and signs. Dynamical Complexity • Dynamics on the network: processes could be taking place on the fixed network. Examples: disease spread, synchronization • Dynamics of the network: the network itself could be evolving in time.
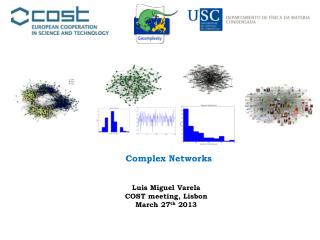
Degree distributions for various networks • World-Wide Web • Coauthorship networks: computer science, high energy physics, condensed matter physics, astrophysics • Power grid of the western United States and Canada • Social network of 43 Mormons in Utah
Contagion Processes on Complex Networks • How does the structure of the network influence the onset of cascades? degree distributions, assortativity, clustering • How do the local rules for interaction change the effects of network structure?
Ordinary Percolation as a starting point for understanding contagion in networks critical supercritical subcritical
Percolation on Complex Networks bond percolation
Extending Percolation to Contagion Models Start with the SIR (susceptible, infected, recovered) model of epidemic disease. The fraction of individuals in the states S, I, and R are governed by the equations: Grassberger (1983) showed that this can be mapped onto a bond percolation problem with occupation probability T given by the following expression
Let pk be the probability density function for the degrees of nodes in the network. Let qk be the probability density function for the degree of a node at the end of a randomly chosen edge: qk=k pk/ <k>. Let f be the occupation probability for each edge. Assume that we start with one node and we want to find the size of the component connected to that node. Let znbe the number of neighbors reachable in n steps. zn+1 = znx the average excess degree of nodes reachable in n steps (the expectation value of (k-1) over the distribution qk)x the occupation probability, f zn+1=f zn(<k2>-<k>)/<k> Critical value of f: f=<k>/(<k2>-<k>) Calculating the phase transition for networks with arbitrary degree distributions that are otherwise random
Resilience of skewed networks to random removals Size of the giant component Occupation probability ( 1 - probability of node removal) Size of the giant component as a function of the occupation probability for three different degree distributions, decreasing skewness from left to right. D. S. Callaway, M. E. J. Newman, S. H. Strogatz, and D. J. Watts,Network robustness and fragility: Percolation on random graphs, Phys. Rev. Lett., 85 (2000), pp. 5468–5471.
Assortative Mixing by Degree • A network is said to be assortatively mixed by degree if high degree vertices tend to connect to other high degree vertices • A network is disassortatively mixed by degree if high degree vertices tend to connect to low degree vertices. Assortative Scale-free network Disassortative Scale-free network
Measured assortativity for various networks M.E.J Newman and M. Girvan, Mixing Patterns and Community Structure in Networks (2002).
How does assortative mixing impact SIR dynamics? • In assortatively mixed networks, the epidemic transition occurs sooner as the transmissability is increased. In other words, epidemics occur at lower transmissability than in neutral or disassortative networks. • In parameter regimes where epidemics readily occur, the number of infected individuals is generally lower for assortatively mixed networks.
The SIRS (Susceptible, Infected, Recovered, Susceptible) Model • Rule: An individual who comes in contact with an infected individual gets infected with probability T if he or she has not been infected in the last t time steps. • Initial Question: How well does the pathogen persist in the population as the average connectivity per node (z) is increased? In the SIR model, the pathogen does better (in terms of larger cascades) when the average connectivity is increased • Application: Influenza • Two ways to approach modeling: • Explicitly model pathogen strains and their mutations • Mean field solution creates a set of difference equations:
Fraction of individuals infected as a function of time, on a randomly mixed graphs with different connectivity z.
Increasing z tends to lead to pathogen extinction • Extreme minimum in oscillations leads to pathogen extinction • Pathogen goes extinct more easily in smaller systems because the fraction of individuals that ‘should’ be infected falls below 1/N.
How Does Community Structure Impact SIRS Dynamics? The addition of community structure tends to increase the pathogens ability to persist because it dampens the oscillations in the number of infecteds. For very strong community structure, the pathogen’s ability to persist is actually lessened because it essentially is forced to operate on a smaller system size.
Limitations of the standard network approach in contagion modeling • Percolation looks at a static picture, real networks are dynamic – example traceroute sampling of the internet. • All edges are treated as equal in strength, when they are probably quite heterogeneous From Newman 2003 From Bearman, Moody, and Stovel
Consider three different mechanisms for interactions • Ordinary imitation: imitate each neighbor with a given probability. (Traditional SIR percolation model). • Herd imitation: individuals look to the bulk behavior of their neighbors. (Threshold model see Granovetter Am. J. Soc.1978 & Watts PNAS 2002) • Reciprocal resource-limited imitation: imitate neighbors based on a “time-sharing” algorithm for determining connection strengths.
Casting the mechanisms in terms of percolation problems • Ordinary imitation: weight between all pairs is equal. Wij=1. Using the tuning parameter f , the probability of each edge being occupied is f *Wij=f. • Herd imitation: the influence on node i by node j is given by Wij=1/kj • Reciprocal resource-limited imitation: the influence on node i by node j is given by: Wij=min(1/ki,1/kj)
Elucidating Model Differences • Ordinary Imitation: all links are taken as equal. • Herd Imitation: neighborhoods are equal. Even with undirected edges, influence is not reciprocal • Reciprocal Imitation: nodes are equal, in the sense that they have equal time to distribute
Effect of degree distributions Ordinary Imitation: phase transition happens at lower f for more highly skewed degree distributions Herd Imitation: phase transition happens independent of skew, if average degree held constant. Reciprocal Imitation: lower transition for poisson distribution. Targeting strategies Ordinary Imitation: targeting high degree nodes is highly advantageous Herd Imitation: targeting high degree nodes is slightly advantageous Reciprocal imitation: targeting high degree nodes is disadvantageous
Interpolating between modes • In herd imitation, the influence of node i on node j is given by • In persuasion, the mutual influence btw i and j is Interpolating:
Extending the Models • Popularity enhanced imitation. • Including broadcast modes that may or may not be connected to network properties. • Individuals can have strategies for splitting their time, and hence connection strengths to others.
Conclusions • Network properties like degree distribution, assortativity, and clustering can strongly influence contagion processes • These effects may change significantly with alteration of the local rules for transmission. • Percolation with bond strengths dependent on node properties is good starting point for exploring these phenomena. • However, consideration of dynamics is sometimes necessary for understanding certain classes of contagion problems.
Collaborators • Mark Newman, University of Michigan • Steve Strogatz, Cornell University • Duncan Callaway, Cornell University, UC Davis • Lauren Ancel Myers, University of Texas, Austin • Erica Jen, Santa Fe Institue • Jessica Flack, Santa Fe Institute • David Krakauer, Santa Fe Institute • Ole Peters, Santa Fe Institute, UCLA • Shane McCarthy, University of Maryland • Danny Bates, MIT