Download
1 / 23
230 likes | 254 Views
This study explores how phytochrome signaling influences the salicylic acid (SA) pathway in Arabidopsis defense responses, impacting protein synthesis, sucrose synthesis, and various biosynthetic pathways. The intricate interplay between phytochrome and SA signaling pathways is crucial for plant defense mechanisms against pathogens.

E N D
Phytochrome signalling modulates the SA-perceptive pathway in Arabidopsis
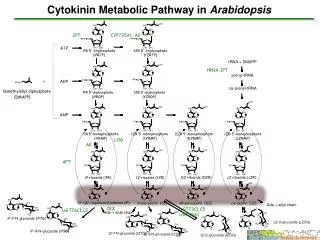
Cytosol Protein synthesis Sucrose synthesis Glycolysis Ubiquitin-proteasome pathway Brassinosteroid biosynthesis Chloroplast Photosynthetic light reaction Calvin cycle Starch synthesis Protein synthesis Photorespiration Amino acid biosynthesis Chlorophyll and/or heme biosynthesis Nitrogen assimilation Sulfur assimilation Golgi appatatus Plasma membrane Cell wall synthesis Nucleus Transcription factors Transcription factors Peroxisome photorespiration Endoplasmic reticulum Cell wall synthesis Microsome Phenylpropanoid pathways Mitochondrion TCA cycle Photorespiration Brassinosteroid biosynthesis Vacuole Water transport Ethylene synthesis Glyoxysome Glyoxidate cycle Fatty acid oxidation
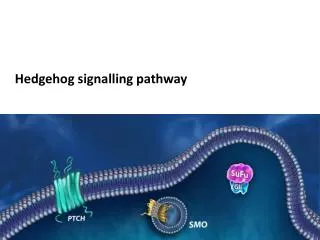
Hypocotyl elongation COP1 COP1 Blue light CRY1 Far-red light phyA Red light phyB
Systemic Acquired resistance Methyl salicylate Hypersensitive response SA Infection SA b-glucoside SA Methyl salicylate SA b-glucoside
The salicylic acid (SA) pathway The salicylic acid (SA) pathway is an important route inserted in the network of defense signalling. The synthesis of PR proteins can be activated by an ectopic treatment with SA or functional analogues such as BTH (benzo(1,2,3)thiadiazole-7-carbothioic acid S-methyl ester). In transgenic Arabidopsis plants expressing a SA-hydroxylase gene of Pseudomonas putida (NahG gene), SA is degraded to catechol leading to a loss of PR1 gene expression, and a higher susceptibility to virulent pathogens.
Interaction of Phytochrome Signalling with The SA Signal Transduction Pathway PR1 PR5 SA LTD (light to defense) Phytochrome A Chloroplast HR Phytochrome B PSI2 Unknown signal
Structures of SAR-inducing compounds Benzo(1,2,3)thiadiazole-7- carbothioic acid S-methy ester 2,6-dichloroisonicotinic acid
Figure 1. The SA and BTH induction of PR1 and chlorophyll is light dependent
Figure 2. The modulation of defense by light is phytochrome-dependent.
Cab2-W-luc expression(counts per seedling/15min) ChS-W-luc expression (counts per seedling/15min) No treatment 6.2 2.8 5' red light 122.0 72.3 SA (250 mM) 6.7 3.0 BTH (1 mM) 7.2 3.7 SA (250 mM) + 5' red light 119.7 68.0 BTH (1 mM) + 5' red light 103.6 61.1 TableS1Effect of red light on the induction of CAB and ChS expression. Five-day-old seedlings grown in darkness were treated with SA or BTH alone, or in conjunction with a pulse of 5 min red light (25 mmol m-2 s-1). Each value represents the average response of two sets of 150 seedlings
(A) H2O+O2 H2O2 Ferric enzyme Compound I H2O2 H2O (B) Ferric enzyme Compound I H2O2 H2O SA• (+H2O) SA SA SA• Compound II
Potential targets in mammalian cells include: • Postaglandin H synthetase • Lactoperoxidase • Myeloperoxidase • Catalase • Aconitase • Methemoglobin • Metmyoglobin Potential targets in plants include: • Hydroperoxide dehydrase • Ascorbate peroxidase • Horseradish peroxidase • Catalase • Aconitase • Leghemoglobin • Aminocyclopropane carboxylic acid(ACC) oxidase
Figure 3. SA content is not correlated to phytochrome activity.
Figure S1 The light modulated expression of PR1 in SA-treated plants is independent of protein synthesis. Three-week-old WT plants were pretreated with cycloheximide, injected with 250 mM SA, and exposed to high light fluences for 30 min.
Table 1. Effect of light perception on the expression of PR genes and the growth of an avirulent pathogen (Pseudomonas syringae pv. tomato DC3000 carrying avrRpt2) Dark (0.1 µmol m-2 sec-1) Light (25 µmol m-2 sec-1) Bacterial titrea(± SD) PR1 expressionb(± SD) Bacterial titrea(± SD) PR1 expressionb(± SD) Plants: Wt 7.4 (0.5) 2.1 (0.8) 5.3 (0.8) 16.3 (2.1) phyA-phyB 7.7 (0.4) 0.8 (0.7) 7.8 (0.6) 3.2 (0.6) psi2 7.3 (0.7) 2.3 (0.9) 4.1 (0.4)35.8 (4.2) phyA-phyB-psi2 7.7 (0.6) 1.3 (0.7) 7.7 (0.4) 3.6 (0.5) NahG 7.5 (0.5) 0.5 (0.3) 7.9 (0.5) 2.8 (0.4) NahG-psi2 7.6 (0.8) 0.4 (0.2) 7.8 (0.5) 4.0 (0.5) aPlants were injected with a solution of 0.5 X10³ bacteria cm 2 and the number of colony forming units were measured 3 days after injection; data are expressed in Log cfu cm 2. bRelative abundance.
Single mutant 3681-variegated Triple mutant 3681-variegated phyA-phyB Double mutant 3681-variegated psi2 Double mutant 3681-variegated psi2 containing the NahG transgene
Figure 4. Influence of chloroplasts on the phytochrome-modulated defense responses.
Figure 5. Schematic representation of the modulation of defense by phytochrome using intuitive (a) and Boolean formalism (b).
Figure S2 The expression of a defensin gene is not upregulated by light: Expression of PDF1.2 under increasing light intensity.