Download
1 / 15
150 likes | 974 Views
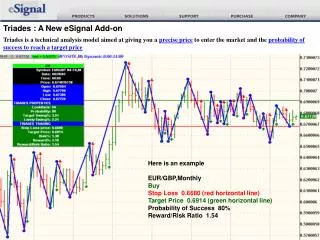
Triades : A New eSignal Add-on. Triades is a technical analysis model aimed at giving you a precise price to enter the market and the probability of success to reach a target price. Here is an example EUR/GBP,Monthly Buy Stop Loss 0.6680 (red horizontal line)

E N D
Triades : A New eSignal Add-on Triades is a technical analysis model aimed at giving you a precise price to enter the market and the probability of success to reach a target price Here is an example EUR/GBP,Monthly Buy Stop Loss 0.6680 (red horizontal line) Target Price 0.6914 (green horizontal line) Probability of Success 80% Reward/Risk Ratio 1.54
Triades is a market timing indicator and a forecasting tool Triades can be applied to any financial product (Futures, Forex, Interest Rates, Commodities, Equities...), and can be calculated on any timeframe (1 Min to Monthly). You will get alerts as soon as a “buying” or “selling” signals is identified. A target price will be associated to any position as well as a reward/risk ratio. Triades is an indicator and not a “black box” Many of our existing clients mix “Triades” with their own indicators. For our trading, we use “Triades” with Bollinger Bands • In this PowerPoint, we will answer the following questions : • What is a “triades” and how a buying/selling signal appears ? • How the target price is defined ? • How to put in place alerts ? • What is our methodology for our trading ?
What is a Triades ? A Triades is constituted by three bars that may include inner bars within the three main bars.This model is only based on the highest and lowest of bars. Indeed the model scans all bars to identify a market reversal
How a signal is generated ? The timing of any signal occurs at a precise price when the software identifies a “Triades”. The signal do not appear “end of bar” but at a price verifying a market reversal on the highest and lowest of bars. Please notice that any signal can be invalidated if, in the same bar where it is generated, the price come back to reach the stop loss ( price where the pivot point sets )
How a signal is generated (continued)? To know at which price a signal is generated, you need to refer to the bar where the pivot is, looking at the highest of this bar for a buying signal and the lowest of this bar for a selling signal. Find below two examples :
How a target price is defined ? This add-on has taken two basic elements from the swing-trading: pivots (extreme points of a market’s fluctuation, either up or down) and swings (price fluctuations). So that, the software pinpoints where a market reversal is, objectively measuring the natural movement of the market in percentage points Between a high pivot and a low pivot you have a bearish fluctuation. To know the measurement of a bearish fluctuation, you set the mouse on the low pivot and look at the « lively swing% » Between a low pivot and a high pivot you have a bullish fluctuation. To know the measurement of a bullish fluctuation, you set the mouse on the high pivot and look at the « lively swing% » To get all swings scanned, go to « tools », then click on « Data Export »
How a target price is defined (continued)? Once all bullish and bearish fluctuations are scanned by the system, it will define the “target swing%” you can expect for the probability of success of your choice. For that, you must enter the “lookback” you want, as well as the “probability of success”. To get these parameters set, you need to “right click” on your graph, then “Edit studies”, and select the study “Triades/Pivots/Swings”. Example If you select “46” for “LookBack Swings” you ask the system to look at the last 46 bearish fluctuations as well as the last 46 bullish fluctuations. If you select “9” or “90%” for the “Probability of success”, the system will give you the fluctuation you can expect or “Target Swing%” for the probability selected. Concretely, for the Dow Jones Industrial (“$INDU”) on a daily basis, 90% of the last 46 bullish swings have reached at least +0.91%. So that, for the current buying position, you have a probability of 90% to reach a target price of 12564.29
How to put in place the alerts ? In order to get the perfect timing, as soon as a buying or a selling signal is generated, you can select the type of alerts you want. In that case, a pop-up will appear on your screen as shown below : There are 3 types of alerts Activated basic alert Activated RRR Level alert Activated Reward Level Alert In that case you will get alerts poping up only once as soon as a buying/selling is Identified. In that case, you ask the system to send you alerts for which the Reward/Risk Ratio is at least equal to your choice. For instance if you enter 2 for the RRR Level, you want the system to send you alerts for which the RRR is equal or superior to 2. So that, you will not get pop-up for which the ratio is inferior to 2. RRR Level = 2 means : you risk 1% to gain 2% RRR Level = 1.47 means : you risk 1% to gain 1.47% In that case, you ask the system to send you alerts for which the Reward Level% is at least equal to your choice. For instance if you enter 4 for the Reward Level%, you want the system to send you alerts for which the Reward is equal or superior to 4% (regardless the risk). So that, you will not get pop-up for which the reward or gain in % is inferior to 4%. Please notice that you can cross both RRR Level alert and Reward Level Alert.
How do we use “Triades” for our trading ? (continued) MEDIUM / LONG TERM TRADING (daily, weekly, monthly) Methodology = Triades + Market fluctuations Triades Unlike the intraday trading, on the medium/long term timeframe, we can trade every signals • Strategy 1 • We take a buying/selling signal provided that • the Reward/Risk ratio is good enough ( >1) • Strategy 2 • Knowing the Target Swing%, we can anticipate a • buying/selling signal. In the case below, if we think the • market will bounce back, we can anticipate a buying signal • from the lowest of the last bar with a bullish fluctuation of • +1.89% +1.89%
Conclusion For your information, a trading competition was done in 2005 ( Nov – Dec 2005) on the Forex with a Swiss trading platform (Real-time Forex). This competition was done in order to get a back testing for three major banks in Europe. 332 trades were made on the 60’, 200’ and daily period on the EUR/USD, GBP/USD, USD/JPY. We arrived third with a result of +285% (please look at “backtesting” on the website www.chl-distribution.com). FAQ • 1. Do I take a signal when it appears or do I wait for the signal to be confirmed at the “end of bar” ? • For short period, we would advise you to enter the market as soon as the signal is generated. • For long term period ( weekly, monthly), things can be seen otherwise. • 2. If I am « short » and the target has not been reached, do I close my position if a buying signal appears ? • -For short period ( from 1 Min to 200 Min), your target is at least the medium bollinger band. If you have a buying signal before having reached the medium Bollinger Band, you must keep your « short position » and respect your initial « stop loss ». • -For long period ( Daily, Weekly, Monthly), we would advise you to close your position and « buy » once the signal is confirmed (can’t unvalidated) at the « end of bar ». Research Area Some research is available on our website at www.chl-distribution.com on the Forex, Commodity, Fixed Income and Equity trading.
Triades Installation on E-Signal To install the « triades » add-on on E-Signal, please follow the instructions below step by step Step 1 First go to C:\Program Files\eSignal Pro\Formulas Then create a new folder « Triades » Step 2 Within the new folder « triades », copy the EFS TriadesPivotsSwings Step 3 Right click on your graph, then select formulas/Add-on Studies, triades and TriadesPivotsSwings.efs Step 4 Right click on your graph, then select Scaling and Scale Price Data Only
Error message If any error message appears, click No in the Syntax Error window, then right-click on your graph, click on Reload and TriadesPivotsSwings, #Formula Error#