Understanding Two-Variable Data Transformations and Causation Analysis
170 likes | 284 Views
This chapter delves into transforming two-variable data for better analysis, focusing on how changing the scale of measurement can clarify relationships. It covers essential transformations such as logarithmic and power transformations that help straighten data for linear analysis. Additionally, the concepts of correlation, regression, and causation are explored, emphasizing the importance of recognizing lurking variables and avoiding misleading conclusions. Cautions about extrapolation and confounding variables are highlighted, ensuring a comprehensive understanding of data interpretation.

Understanding Two-Variable Data Transformations and Causation Analysis
E N D
Presentation Transcript
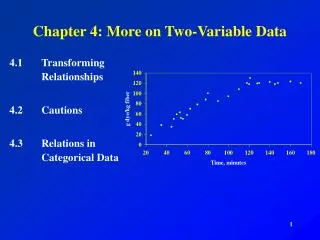
Chapter 4More on Two-Variable DataYMS 4.1 Transforming Relationships
Basics • Transforming data • Changing the scale of measurement used when the data was collected • Ch 4 Transforming • Choose a power or logarithmic transformation that straightens the data • Why? We know how to analyze linear relationships! • Monotonic Function • f(t) moves in one direction as t increases
Algebraic Properties of Logarithms • logbx = y if and only if by = x • Multiply/add • Log (AB) = Log A + Log B • Divide/subtract • Log (A/B) = Log A – Log B • Power to front • Log (x)A = A*Log x
Growth • Linear • Increases by a fixed amount in each equal time period • Exponential • Increases by a fixed percentage of the previous total • y=abx
Plot log y vs. x • If a variable grows exponentially, its logarithm grows linearly log y = log abx log y = log a + logbx log y = log a + xlogb
Power Models • Ladder of Power Functions p201 • y = axp • Take logarithm of both sides straightens the data log y = log (axp) log y = log a + logxp log y = log a + plogx p213 #4.10-4.11 Homework: p222 #4.17 to 4.20
YMS 4.2 Cautions about Correlation and Regression
Some Vocabulary • Extrapolation • Predicting outside the domain of values of x used to obtain the line or curve • Lurking variable • Is not among the explanatory or response variables but can influence the interpretation of relationships among those variables • Can dramatically change the conclusions
Reminders! • Correlation and regression only describe linear relationships and neither one is resistant! • Using averaged data • Correlations based on averages are usually too high when applied to individuals p230 #4.28 and 4.31
Explaining Association • Causation • May not generalize to other settings • A direct causation is rarely the complete explanation • Is established by an experiment where lurking variables are controlled x y
x y • Common Response • The observed association between x and y is explained by a lurking variable z • An association is created even though there may be no direct causal link z
x y • Confounding • Two variables whose effects on a response variable are undistinguishable • May be either explanatory or lurking variables p237 #4.33 to 4.37 ? z
Establishing Causation • Strength • There is a strong association between variables • Consistency • Many different studies show the same results • Response • Higher explanatory values produce a higher response • Temporal Relationship • Alleged cause precedes the effect in time • Coherence • The alleged cause is plausible/logical
YMS 4.3 Relations in Categorical Data
Two-Way Tables • Row variable/Column variable • Marginal Distributions • Found at the bottom or right margin • Are entire rows/columns over the total • Conditional Distributions • Only a cell that satisfies a certain condition (given in the row/column)
Simpson’s Paradox • The reversal of the direction of a comparison or an association when data from several groups are combined to form a single group • Alaska Airlines vs. American West • Business vs. Law School Admissions Workshop Statistics 7-2 and 7-4