One-Variable vs. Two-Variable Data Analysis
Learn the differences between one-variable and two-variable data sets, including examples and how to recognize each type using various charts and graphs.

One-Variable vs. Two-Variable Data Analysis
E N D
Presentation Transcript
One Variable Data One-variable data sets give measures of ONE ATTRIBUTE.
You can recognize one-variable situations when you see: • Tally charts • Frequency tables • Bar graphs • Histograms • Pictographs • Circle graphs
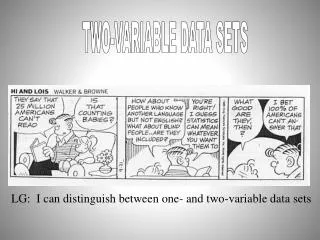
Two Variable Data Two-variable data sets give measures of two attributes for each item in a sample.
You can recognize two-variable situations when you see….. • Ordered pairs • Scatter plots • Two-column tables of values
One OR Two Variable Data? • Noah researches annual hours of sunshine in Canadian cities • A study compared the length of time children spend playing video games and the time they spend reading
Fill in the blanks…… As population of a city increases, increases. As population of a city increases, decreases. As temperature increases, increases.