Download
1 / 29
290 likes | 409 Views
Dr. Herron-Thorpe will meet at 10:00 AM to assign the greenhouse gas survey team tasks for CE 401. Review questions from last Tuesday on orbital variations and radiative forcings, and complete Homework 4 due on January 31, 2012. Key concepts include changes in Earth’s equilibrium temperature due to CO2 removal, radiative forcing effects, and the significance of aerosols in climate modeling. Focus on the implications of greenhouse gases, including CO2, CH4, and N2O emissions, and their global warming potential.

E N D
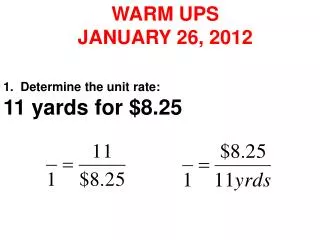
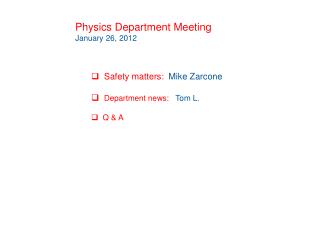
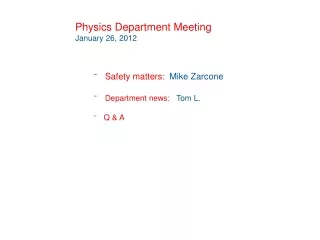
26 January 2012 Dr. Herron-Thorpe will arrive at 10:00 to have you do the greenhouse gas survey
any questions from last Tuesday [orbital variations, radiative forcings] aerosols HW 4 is posted on the web – due Tuesday 1/31/2012 read MacKay pgs 241-245
HW 3: 1a: 0.05°C change in temperature with 1 w/m^2 change in solar irradiance 1b: albedo change from 31 to 30% ~ 1°C change in temp 1c: eccentric earth orbit ~4°C change in temp (2) in the figure below, approximately estimate the change in Earth equilibrium temperature (currently 288K) that would occur if CO2 were completely removed from the atmosphere. In the graph below, the large drop in intensity of Earth radiance (an absorbance) near 680 wavenumbers is caused by 392 ppm CO2.
Now I can relate area to temperature. T[K] area[sq] 220 310 240 423 260 583 280 783 Earth 859 300 1062
relationship of area on my piece of graph paper to temperature
Now measure the area under the CO2 absorption: just dot the Earth curve in above the absorbed area and count squares in the absorbed area 76 sq. Subract 76 from 859 = 783 and compute the temperature from the best fit above, or just read it off the curve 783 sq corresponds to a temperature of 280K the change in temperature is about 8°C (288 – 280K).
factors that influence the radiative equilibrium of the Earth system average solar input: 342 w/m2 source IPCC 2007
global warming potential (GWP) of a gas [GWPg]: a weighting factor to compare the GHG efficiency of a gas relative to CO2. Compares potency of GHG to that of CO2: GWPg = Fg x Rg(t) dt / FCO2 x RCO2 dt where the integral is from time 0 to time T Fg = radiative forcing efficiency of the gas in question [w m-2 kg-1] FCO2 = radiative forcing efficiency of CO2 [w m-2 kg-1] Rg = fraction of the 1 kg of gas remaining in the atmosphere at time t RCO2 = fraction of the 1 kg of CO2 remaining in the atmosphere at time t radiative forcing efficiency is usually an exponential decay function, or ~ constant with time, depending on the gas. For CO2 the decay is rapid the first few decades as the biosphere absorbs the carbon, then it decays at a much slower rate corresponding to the slow CO2 uptake of the oceans Choice of time horizon for GWP depends on what a policy maker is interested in e.g. CH4 GWP is 62 for 20 yr horizon, 23 for 100 yr, and 7 for 500 yr
compare CO2 to CH4 and N2O emissions for warming potential: emissions: CO2 = 27,000 MMt CO2/yr US emissions CH4 = 370 MMtCH4/yr N2O = 6 MMt N2O/yr [MMt = million metric tons] compare impacts to CO2: CH4: GWP100 = 23*370 = 8510 MMtCO2 equivalent N2O: GWP100 = 296*6 = 1776 MMtCO2 equivalent
aerosols and their effects on climate • big driver – HUGE driver, both human induced and natural RF • not well understood – hardly on the data sheets in 1990 • not well measured – satellites and ground networks – short record of data • parameters that affect aerosols and their RF not understood • global effects not well understood – clouds (height and distribution)
aerosols: • solid particles or liquid particles suspended in the air • size: few nanometers to microns in size: x100 - 1000 variation in size • have major impacts on climate • physical properties: shape, size, chemical composition • EPA regulates particles in the US PM10 and PM2.5 – CEE 341, 415 • key aerosol groups: • sulfates • organic carbon • black carbon • nitrates • mineral dust • sea salt • aerosols of clump together to form complex mixtures • 90% of aerosols (by mass) are natural in origin • about 10% of global aerosols are generated by human activity • problems in dealing with aerosol effect: diversity in size, composition and origin; • spatial and temporal variability; source; injection height • aerosols removed primarily through cloud processing and wet and dry deposition
aerosol RF effects are categorized into direct and indirect effects: • direct: mechanism by which aerosols scatter and absorb radiation change in the • radiative balance of the Earth system • organic carbon, sulphate, nitrate, black carbon, dust, biomass burning • indirect: mechanism by which aerosols modify the microphysical and hence the • radiative properties, amount, and lifetimes of clouds • size, shape, chemical composition, etc.
volcanic pollen sea salt soot fossil fuel combustion SO2 which reacts with H2O and gases to sulfate aerosols biomass burning organic carbon and black carbon transportation sector prolific producer of aerosols aerosols are usually modeled as spherical in shape – do they look spherical?????? properties: shape, size, composition, chemistry, polarization, index of refraction, mass,
- aerosol optical depth is the fundamental measure of quantity and distribution of aerosols - absorbance is proportional to exp{-t} where t is the optical depth. AOD is a measure of incident light scattered or absorbed. 2003-2006 average AOD t is prop to path length and extinction cross section
global aerosol distribution. Yellow = coarse particles like dust, red = fine particles like smoke or air pollution. MODIS data
different aerosols scatter or absorb sunlight differently depending on physical prop black carbon effects - modeled
indirect effects of aerosols: cloud formation and cooling • aerosols play a critical role in cloud formation • natural aerosols are most important • but human produced aerosols have a significant impact ship tracks – white clouds and map of cloud droplet size where ship exhaust is mixed with cloud layer, droplets are smaller
measurements of aerosols from satellites and networks of instruments AERONET
NASA Global Hawk at Edwards AFB, CA you guys ought to get involved in atmospheric studies – it is one heck of a lot of fun!
outstanding issues in aerosol effects on climate change: • composition • optical absorption • impacts on surface radiation and heating • long term trends • total RF