Download
1 / 17
170 likes | 194 Views
Detailed research examining NubiScope's cloud detection capabilities in laboratory and field settings, offering insight on contamination, automated observations, and spatial representativeness.

E N D
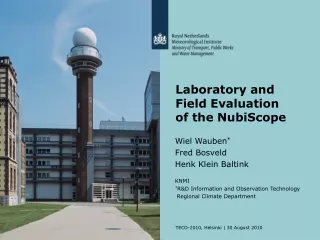
Laboratory and Field Evaluation of the NubiScope Wiel Wauben* Fred Bosveld Henk Klein Baltink KNMI *R&D Information and Observation Technology Regional Climate Department
Contents Introduction NubiScope Laboratory tests contamination Field evaluation cloudiness Conclusions and outlook
Automated cloud observations SYNOP cloud observations fully automated since 2003 Hourly manual SYNOP versus LD40 with cloud algorithm 6 stations with 3 years overlap data Introduction
Experiences AUTO versus Observer Missing high clouds / sensitivity Moist layer reported as cloud / threshold “Gaps” in cloud deck during precipitation Missing information during shallow fog Faulty isolated hits / instrumental noise, precipitation, aircraft, ... Fewer cases with 1 and 7 okta compared to observer Missing spatial representativeness scanning Introduction
NubiScope scanning pyrometer (passive day & night) 8-14mm thermal IR (contribution of moisture) FOV=3° (mixed scenes) scan every 10 minutes step azimuth 10° step zenith 3° 1080 sky temperatures 2 surface temperatures T range -70+50°C Total cloud cover >20° low, middle, high cloud cloud mask Overview FD12P De Bilt Test
NubiScope Sky temperatures Boundary cloud processing < 70° SZA Polynomial fit to clear sky Eliminates moisture/contamination Deviations indicate clouds Sun Horizon gives Tambient, start of standard T profile
NubiScope Cloud mask Discontinuity near North Derived cloud mask
Laboratory tests Setup
Laboratory tests Effect contamination pyrometer lens
Laboratory tests Stability pyrometer (clean lens) 2 years εGalai = 97.3 %
Manual evaluation total cloudiness NubiScope versus LD40 (10-minute window used in METAR) Using Total Sky Imager (TSI) images at start/end of scan Evaluation by observers Rotterdam airport (25 km from Cabauw) Data and evaluation via Web tool. Field evaluation Weather Dpt.
Overview manual evaluations Period 1 June to 16 August 2009 243 evaluations (10’ or longer periods) Scores assigned to NubiScope and LD40 +1 (good) of -1 (false) “Scores” of NubiScope much better than LD40 Discrepancies of LD40 mainly due to lack of spatial representativeness NubiScope generally better than LD40 at detection of middle and high clouds ... but sometimes not Field evaluation Weather Dpt.
Evaluation total cloud cover Evaluation fractional cloudiness LD40, NubiScope, LIDAR, cloud radar, long wave IR radiation Goal: optimal cloud product for Cabauw presentation 2(4) Example: Total cloud cover NubiScope versus LD40 for period 14 May 2008 - 30 September 2009 Field evaluation Climate Dpt.
Evaluation total cloud cover contingency matrix Field evaluation Climate Dpt. • Scores LD40 versus NubiScope in agreement with LD40 versus OBS and better 0-1 en 7-8 okta behaviour
Effect of scanning Field evaluation Climate Dpt. n = 0 and 8 ▼ n = 1and 7 ▲ n = 2 to 6▲
Conclusions NubiScope has added value for total cloudiness compared to LD40 mainly due to scanning / better spatial representativeness Effect of contamination is “small” and can be monitored. Climate Dept. decided to keep the NubiScope as part of the Cabauw/CESAR infrastructure Weather Dept. noted added value of NubiScope but accurate height information is essential / required Make NubiScope operational (maintenance, ...) Improve timeliness by scanning continuously with “running” updates Investigate / improve NubiScope cloud base height (coincidences with LD40, T-profile, moisture correction, ...) Conclusions & Outlook Outlook
Thank you for your attention!Lookup conference paper for more informationSee paper 2(4) for more details on evaluation of cloudinessAcknowledgementsRob van Krimpen, Cor van Oort, Mark Savenije, Siebren de Haan, and observers at Rotterdam Airport (all KNMI)Hans Möller (IMK) and Theo Sattler (Sattler-SES)