Download
1 / 42
440 likes | 760 Views
Field Sampling for Pretreatment and the Laboratory. 25 th Annual Region IV Pretreatment Association Workshop Addison, Texas August 2009. Presented by: Bill Gase – The City of Dallas – Dallas Water Utilities Prepared by: B. Gase and E. Kasey – The City of Dallas – Dallas Water Utilities.

E N D
Field Sampling for Pretreatment and theLaboratory 25th Annual Region IV Pretreatment Association Workshop Addison, Texas August 2009 Presented by: Bill Gase – The City of Dallas – Dallas Water Utilities Prepared by: B. Gase and E. Kasey – The City of Dallas – Dallas Water Utilities
Question of the Day • How does Monitoring (Field Sampling) impact Pretreatment and the Lab?
The Pretreatment and Laboratory Services (PALS) Division performs routine sampling of industries, commercial enterprises, wholesale customer cities, and other facilities which could have a potentially harmful discharge of wastewater into the City of Dallas sanitary sewer system.
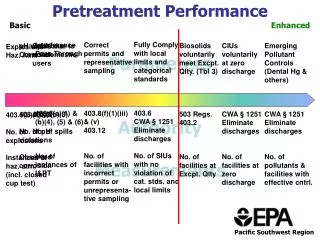
Authority for these actions are granted by federal, state, and local pretreatment standards and regulations
FEDERAL [40 CFR 403.8(f)(2)(v)] “Randomly sample and analyze the effluent from Industrial Users and conduct surveillance activities in order to identify, independent of information supplied by Industrial User, occasional and continuing non-compliance with pretreatment standards. Inspect and sample the effluent form each Significant Industrial User at least once a year…”
STATE [40 CFR 403.10(f)] The State NPDES permit is the regulatory document issued by either the EPA or TCEQ. The permit is designed to control the discharge of pollutants from contributing industries in accordance with pretreatment standards..
DOCUMENTATION LINKO Analysis Request Sheet (ARS) / Chain of Custody Daily Activity Report (DAR) Field Inspection Report Site Maps
Daily Activity Report (DAR) This form is filled out each day field activity is performed.
Site Maps Please Remember who uses the maps. The Monitoring Crew
Goals of Field Sampling • To determine the impact of industrial wastes on the POTW • Evaluate compliance by all Industrial Users (IUs) with applicable pretreatment standards and requirements • Provide the Industrial Pretreatment Program with assurance that the information and data generated is accurate, reliable, and defensible
Objectives that can be accomplished through Monitoring Activities • Profiles of waste streams coming into collection system • To maintain up-to-date information on SIUs • Verification of compliance status • Support of enforcement activities • Identify and locate sources of problem discharges • To provide data used to support IU surcharges for revenue • Foundation for the development or amending local discharge limits • The data generated can provide the necessary preparation of annual report and plant expansion
Frequency of Monitoring Events • The Pretreatment Program has been charge with the responsibility to determine the frequency at which sampling will take place. • Factors that can be used to determine frequency: • Seasonal production schedules at the SIU • Past compliance or performance by the SIU • The waste stream constituents and volume • Problems within the collection system and POTW which are the results of a particular SIU • The introduction of new or additional pretreatment requirements
Monitored Group NonSIUs Noncategorical IUs Categorical IUs Customer Cities QC Sampling Frequency Once per year Twice per year Four times per year 12 times per year 1 out of 10 sample site (sites with samples) Frequency of Monitoring Groups
Supplies for Local Limits Cubitainer : $3.84 TSS/ BOD: $1.44 Metals B: $2.32 Phenol: $2.22 TOG/TPH: $4.44 Cyanide: $0.68 2-BTEX: $2.20 2-Alcohol: $1.64 Teflon Tubing: $192.00 / 50’ In addition to preservatives, QC sampling, and TTI lab cost ($220.00)… Total cost: >$300.00 Interferences and Potential Problems
Interferences and Potential Problems • Gaining site access • Low flows volumes / No Flow • High flow volumes • Clogged intake tubing • Equipment malfunctions • Contamination • Weather • Traffic
Monitoring Operating Procedures • Monitoring SOP (MON-01 Rev 2) • pH Meter Calibration and Use (MON-02 Rev 0) • Storage Temperature Monitoring (MON-03 Rev 0) • Customer City Sampling (MON-04 Rev 1 is Pending Approval) • Preventive Maintenance Program (MON-05 Rev 0 is Pending Approval) • Spill Notification and Response Work Instructions for Sample Site Overflows (MON-06 Rev 0)
Field Equipment • Hand Pump • Compositor Sampler • Either ISCO or American Sigma • Do have capability to monitor pH during the compositing cycle with three of our ISCO samplers • Batteries for the Samplers • pH Meters and Electrodes • Meters are calibrated each day of use • Security Box
Other Equipment • Portable Sample Coolers • Vehicles (one truck and a few Vans) • Bottles • Chemicals for preservation and calibration • Chlorine Test Strips and Sulfide Test Strips • Battery Charging Stations • Pump Tubing • Teflon, Silastic and Silicone
Grab and Composites • Grab Sample – a Sample collected at one time (one aliquot) • FOG, pH, BTEX, Alcohols, TPH, O&G, Phenols, Volatiles, BNA’s, & Cyanide (total and Amenable) • Composite Samples – More than one grab sample combined with the total collection time greater than 15 minutes • Metals, BOD & TSS
Grab and Composites • What is FOG? • At PALS there are two definitions for FOG • Liquid Waste – FOG = Fats, Oils and Grease • Rest of PALS – FOG = Floatable Oil and Grease • What is BOD? • BOD is Biochemical Oxygen Demand • A measure of the amount of oxygen consumed in the biological processes that break down organic matter in water. The greater the BOD, the greater the degree of pollution
Grab and Composites • What is TSS? • This is the Total Suspended Solids. • These are non filterable solids as determined by filtering a known volume of liquid through a glass fiber filter. • What Makes up Metals A? • Cadmium, Chromium, Copper, Lead, Nickel, Silver and Zinc • What is Metals B? • Metals A list plus Mercury and Arsenic
Preservation • BOD/TSS, Alcohols, BNA’s, FOG – cool to < 6 C • Metals – adjust to pH < 2 with Nitric Acid • Cyanide (total and amenable) • Add Ascorbic Acid is Chlorine Residual is present • Add Cadmium Chloride if Sulfides are present • pH > 12 with Sodium Hydroxide • Phenol, O&G – pH < 2 with Sulfuric Acid and cool < 6 C
Preservation • TPH – pH < 2 with HCl and cool < 6 C • BTEX, VOC’s – pH < 2 with HCl and cool < 6 C • Note: Check with your lab. • Halocarbons – Dechlorinate, cool < 6 C • This is a 14 day holding time per 40CFR 136.3 Table II • Aromatics - Dechlorinate, cool < 6 C • For a 14 day holding time adjust pH < 2 with HCl • For a 7 day holding time no pH adjustment is needed • per footnote 9 in 40CFR 136.3 Table II
Typical Bottle Types and Sample Volumes • For BOD/TSS • Composite sample, 1 L volume in one Poly Bottle • For Metals • Composite sample, 250 mL to 500 mL volume in one Poly Bottle • Oil and Grease • Grab sample, 1 L volume in on Glass Bottle • Cyanide (total and amenable) • Grab sample, 250 mL to 1 L volume in one Poly Bottle • Volatile Organics • Grab sample, 40 mL volume per vial in two VOA vials • Semi Volatile Organics • Grab sample, 1 L volume in one Glass Bottle • Total Phenolics • Grab sample, 1 L volume in one Glass Bottle See 40CFR 136.3 Table II for list of bottle types
Field Testing • Measure pH • Calibrate daily with a three point calibration • Use pH 4, 7, and 10 buffers. • If measure pH is a violation recalibrate meter and take a second reading. • If violation is pH is > 10.5 recalibrate using pH 4, 7 & 12 buffers. • Measure Temperature • Record temperature from the pH meter
Field Testing • Test for Chlorine Residual • Use Chlorine Residual Test Strips • If present, sample may need to be dechlorinated, depending on the test that is to be performed. • Dechlorinate by adding a reducing agent (Ascorbic Acid, Sodium Thiosulfate, etc.) • Test for presence of Sulfides • Use Lead Acetate Paper • If present then add preservative • Adjust pH > 12 then add Cadmium Chloride. (Filter?)
The Lab • There are Three Groups that analyze samples for DWU-PALS Pretreatment • Monitoring Section (pH only) • Contract Lab (located in the DFW Area) • Analytical (located at CWTP) • Currently analyzes BOD and TSS only • Will shortly also analyze for Benzene, Toluene, Ethylbenzene, total Xylenes and Methylene Chloride (BTEX) • Please note that BTEX typically does not include Methylene Chloride. The addition of Methylene Chloride to the list is unique to DWU-PALS Pretreatment.
Questions, Questions, Questions • When generating a chain of custody for a site ask yourself this? • Is this really needed? Is this additional sampling? Have we met our programs goals in sampling? Is there a history of violations? What is the value added benefit of doing the additional sampling? • Do we really need to do a surcharge survey? • Are previous results near the 250 mg/L surcharge level? If not, then why do the testing?
BOD and TSS • Surcharge on values of > 250 mg/L • Surcharge Surveys are four day events. • No need to do a surcharge survey if the BOD and TSS values are less than 250. • A 4 day event uses 4 bottles, 4 cubitainers. • Surcharged survey’s need to be scheduled at the beginning of a billing cycle. • For each BOD Sample the Lab performs the following test: • pH, Chlorine Residual and Chemical Oxygen Demand
Supplies for one Site Surcharge Survey Cubitainer : $3.84 each (4 x 3.84 = $15.36) TSS/ BOD: $1.44 each (4 x 1.44 = $5.76) pH measurement in the Field: 4 pH measurement in the Lab: 4 Chlorine Residual measurements in the Lab: 4 COD measurements in the Lab: 4 BOD bottles setup in the Lab: 3 to 5 each day – 12 to 20 TSS tests to run: 2 each day – 8 total Surcharge Survey Info
BOD Preparation Form One thing to look at in reviewing the BOD prep data is to look at the pH of the composite. Note that in this example that site 716-1 has an initial pH of 4.57. This would indicate that the industry had a low pH effluent during the past 24 hours based on sample date. Samples for BOD analysis need to be in the pH range of 6.0 to 8.5 with no Chlorine Residual. COD is Chemical Oxygen Demand. This test is used to estimate the volume needed to get a valid BOD result. COD values are almost always higher than BOD. COD uses a strong oxidizer. This results in an almost complete (>95%) oxidation of organic material.
BOD Quality Data Sheet • Quality Control Criteria • Dilution Water • Depletion ≤ 0.2 prefer < 0.1 • Seed Controls • % Depletion – 40% to 70% • Correction Factor range between 0.60 and 1.00 • GGA – Glucose Glutamic Acid Standard • BOD value range of 167.5 to 228.5
BOD Analysis Data Sheet • BOD Samples are prepped in 3 to 5 dilution ranges. • The minimum depletion must be 2.0 mg/L. • The minimum final DO ready must be ≥ 1.00 • All valid results are averaged together
The end at last • Remember, • More than one group is impacted by Pretreatment. • Pretreatment impacts Sampling and the Lab. • Sampling impacts Pretreatment and the Lab. • The Lab impacts Pretreatment and Sampling. • Is the requested Needed? What is its impact on the environment? • REMEMBER – Reduce Our Impact on the Environment.
The End • Thanks to all and to all a good night. • The end.