Controlling Control Charts Interpreting p -values Intermediate Statistics for ICPs
670 likes | 821 Views
Controlling Control Charts Interpreting p -values Intermediate Statistics for ICPs. Ona Montgomery RN, BSN, MSHA, CIC Anne Denison, RN, BSN, MS Texas Society of Infection Control Practitioners October 2006. Objectives.

Controlling Control Charts Interpreting p -values Intermediate Statistics for ICPs
E N D
Presentation Transcript
Controlling Control Charts Interpreting p-valuesIntermediate Statistics for ICPs Ona Montgomery RN, BSN, MSHA, CIC Anne Denison, RN, BSN, MS Texas Society of Infection Control Practitioners October 2006
Objectives • Discuss the basic principles of epidemiology as they apply to monitoring of infections in a health care setting. • Differentiate between common cause variation and special cause variation. • Interpret statistical significance through the use of control charts and p-values. • Relate the use of statistical analysis to action plans and intervention strategies.
Why Epidemiology? • Systematic way to look at health problems • The focus is on defining a problem in order to focus on prevention • Understand the cause of disease • Plan interventions • Evaluate preventive measures • Applies to diverse situations, flexible
Epidemiology Key Points • ‘distribution’ – frequency of disease in a specific population • ‘determinants’ – factors or events associated with changes in health outcomes • ‘population’ – a group of people rather than an individual
Prevention of osteoporotic hip fracture Medical / Clinical model Target persons at risk based on low BMD Intervention: pharmacotherapy Epidemiological model Target populations at risk Intervention: broad based changes in health behaviors of populations, exercise, smoking Epidemiological Perspective
The chain of infection Causative agent Reservoir Portal of exit Mode of transmission Portal of entry Susceptible host Infectious Disease Process
Why determine causality? • Identify points where disease process can be interrupted • Develop prevention and control efforts that decrease the outcome measured • Identify the natural history of disease
Numerators and Denominators • Numerator - the outcome or process you will “count” • Denominator - “out of how many” • Must be clearly defined (and written down)
Case Definitions • Internally created • Especially useful in outbreak situation where the organism has not been identified – Eg. Gastroenteritis or respiratory illness in a nursing home • Surveillance definitions ≠ clinical diagnoses • Clearly define both the numerator AND denominator • Choose carefully, difficult to modify mid-stream
Case Definition • National Nosocomial Infection Surveillance (NNIS) • http://www.cdc.gov/ncidod/dhqp/nnis_pubs.html • Standardized criteria and case definitions • Clinical signs and symptoms • Laboratory results • Physician actions/diagnoses • Applies to inpatient hospitals • McGeer et al. • Long term care setting • Rehabilitation setting
CDC Acute Care Definition: Symptomatic Urinary Tract Infection Criterion 1: Patient must have • 1 of the following: • fever, urgency, frequency, dysuria or suprapubic tenderness - AND - • Positive urine culture with > 100,000 col/ml with < 2 species
UTI definition continued Criterion 2: Patient must have • 2 of the following: • fever, urgency, frequency, dysuria or suprapubic tenderness - AND - • 1 of the following: • positive dipstick test • pyuria (>10 WBC/cc) • organisms seen on gram stain of unspun urine • 2 urine cultures, same organism, > 10,000 col/ml, in non voided specimens • Physician’s diagnosis/ initiation of antimicrobial therapy
Device Associated Rates • Numerator = events • Denominator = device days • Catheter associated UTIs per 1000 Foley days • 4 UTIs / 235 days x 1000 = 17 CUTI per 1000 Foley days • CL-BSI per 1000 CL days • VAP per 1000 ventilator days
http://www.cdc.gov/ncidod/hip/nhsn/members/PSProtocolsMay06.pdfhttp://www.cdc.gov/ncidod/hip/nhsn/members/PSProtocolsMay06.pdf
Apply Risk Stratification Methods Risk stratification simply means subdividing (stratifying) your surveillance population into groups at similar levels of infection risk prior to performing any analyses or comparisons. To ensure comparing “apples to apples”
Patient-specific Risk Score Total 0-3 points Wound class class III or IV 1 point ASA score 3, 4, 5 1 point Duration of surgery > cutpoint 1 point CDC NNIS Risk Index for SSI Surveillance
SSI – Wound Class vs NNIS Class Wound ClassAll NNIS 0 NNIS 1 NNIS 2 NNIS 3 Clean 2.1% 1.0% 2.3% 5.4% N/A Cl /Contam 3.3% 2.1% 4.0% 9.5% N/A Contaminated 6.4% N/A 3.4% 6.8% 13.2% Dirty infected 7.1% N/A 3.1% 8.1% 12.8% All 2.8% 1.5% 2.9% 6.8% 13.0% NNIS. CDC. Am J Infect Control. 2001;29:404-421.
Elements of the NNIS Risk Index Operation >t hours Wound class ASA class NNIS Risk Category Patient 1 Yes Dirty 4 Patient 2 No Clean 2 Patient 3 Yes Clean-contaminated 2 CENTERS FOR DISEASE CONTROL AND PREVENTION Determining the NNIS Risk Index Category in 3 Patients
Infection Rate And Timing of Prophylactic Antibiotics 14/369 14/441 1/81 1/47 1/41 2/180 5/699 5/1009 Classen DC et al, NEJM, 1992
CDC NNIS Risk Stratification for High Risk Nursery (HRN) Surveillance Stratification by Birthweight Categories: • </= 1000 grams • 1001-1500 grams • 1501-2500 grams • >2500 grams
Interpretation of this surveillance data • Compare to NISS report risk class by strata • example On the UP side, you are the healthiest patient in ICU
BSI Rates in MICU and SICU NNIS 90th percentile NNIS 10th percentile See: Am J Infect Control 2002;30:458-75.
BSI Rates in MICU and SICU NNIS 90th percentile NNIS 10th percentile See: Am J Infect Control 2002;30:458-75.
EXAMPLE OF CALCULATING RISK-ADJUSTED RATES Colon surgery # Risk Factors #SSI #Operations Rate % 0 2 48 4.17% 1 5 77 6.49% 2 4 39 10.26% 3 1 5 20.00% TOTAL 12 169 --------
Ratios Proportions Crude Rates Adjusted Rates Incidence Prevalence Attack Rates Mean Median
Control Chart Theory • Looking at a system / population • Individual measurements are unpredictable • BUT, if all observations are from a stable common system, as an aggregate they will follow a predictable pattern of distribution
Gaussian Distribution Function ‘Normal curve’
Normal pattern of common cause variation Standard Deviations
Types of variation • Common cause variation • Part of the natural process • Always present • Partially unknown • Difficult to control
Types of variation • Special cause variation • Larger variation • Special or non-typical event • Easier to pinpoint in time • Sentinel event
Sources of Variation • People • Machines • Materials • Methods • Bias
Both kinds of variation are important in a health care setting • Monitor common cause variation • Look for non random patterns that may indicate positive or negative trends • Monitor special cause variation • Identify critical system errors and analyze to prevent recurrence
Control Charts, Components • Data in the form of a line graph • Statistical parameters • Mean • Upper Control Limit • Lower Control Limit
Control Chart UCL MEAN LCL
Standard deviation= square root of the variance Or let Excel do it for you!! Insert Function ‘Select a function’ = STDEV
Art and Science • Surveillance, tracking and plotting the data = Science • Interpreting the data for effective and appropriate response = Art • Achieve a balance / flexibility • Avoid tampering • React appropriately
Tampering • Identify a ‘trend’ where there is none • Try to explain natural variation as a special event • Blame or credit people for processes they have no control over • Makes it difficult to understand past processes • Makes it difficult to plan future priorities and interventions
Spotting Special Cause Variation • Non-random patterns • Points more that 3 SDs from mean • Two of 3 successive points more than 2 SDs from mean • Four of 5 successive points more than 1 SDs from mean • Eight successive points on one side of the center line • Six successive points increasing or decreasing (trend)
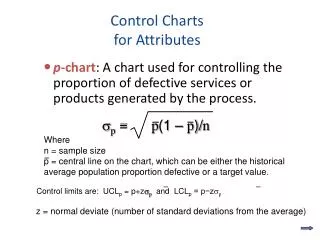
P-Charts, G- Charts • P-Charts track percentage data • Surgical infection rates into control chart • G-Charts track days between events • Number of days between on the job accidents • Good for tracking rare occurrences (like VRE infections – I hope) • Real time – ‘Early warning system’
Relate the use of statistical analysis to action plans and intervention strategies • Data are the raw materials • Statistical analysis provides the tools • Use the data analysis to drive intervention
Only You Can Prevent Pneumonia • Walk, Walk, Walk • Use your incentive spirometry (deep breathing device) • Breathe deeply, turn and cough