Download
1 / 11
120 likes | 229 Views
Explore the geophysical survey conducted on Line 4 by Boise State University, detailing data processing techniques, interpretation of seismic waves, and insights gained from frequency analysis. Discover the challenges faced in obtaining accurate results and potential avenues for improvement in future studies.

E N D
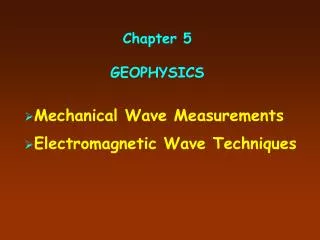
Reflection Methods and ResultsGeophysics 492/692 L Josh Michaels, Zach Reynolds, Nick Prina, Molly Hunsaker Survey run by Dr. Lee Liberty of Boise State University
Line 4 Location Map Lakeside Drive and Manzanita Lane to the north corner of Jasper Lane and Manzanita Lane.
Methods • 1 meter geophones and source intervals • Usually 3 shotsat each source location • Seismographs record each shot individually • Not stacked in the field • Used rollbox to keep the source centered • Excluding the ends of the line
Processing Data • Line 4 = 887 total shot records of 120 traces each • Processed using JRG and Viewmat (v. 3.6.3) • Selected records examined with a range of bandpass filters • Designed to maximize reflections and minimize other seismic waves and noise • 20-100 Hz (10% dip) optimal for reflections in Line 4 • Individually examined every record; removed any traces that failed our criteria • Non-functioning or incorrectly functioning geophone traces • Bad records caused by a misfired trigger on the source, indicated by no coherent seismic wave pattern • Strong hyperbola patterns caused by movement along the reflection line during recording
Processing Data • Line 4 = 887 total shot records of 120 traces each • Processed using JRG and Viewmat (v. 3.6.3) • Selected records examined with a range of bandpass filters • Designed to maximize reflections and minimize other seismic waves and noise • 20-100 Hz (10% dip) optimal for reflections in Line 4 • Individually examined every record; removed any traces that failed our criteria • Non-functioning or incorrectly functioning geophone traces • Bad records caused by a misfired trigger on the source, indicated by no coherent seismic wave pattern. • Strong hyperbola patterns caused by movement along the reflection line during recording. • Constant velocity stacking • Ranged from 500 to 3500 m/s (100 m/s intervals) • Stacking reduces random-sourced signals
Dip-filtered CMP stack • Dashed black lines = interpreted faults • Green shapes = artifact errors
Frequency Analysis • From the unfiltered CMP stack • Dominant frequencies at ~30Hz
Improvement? • More controlled acquisition environment • Geophone functionality • Removal of 60 Hz electrical noise • Known to exist, but not dominating signal • More thorough velocity model • Our results are only preliminary • Pre-stacked depth migration