Download
1 / 38
380 likes | 539 Views
Encoding and exchanging graphical representation: architecture and formats. Fedor Kolpakov Institute of Systems Biology Novosibirsk, Russia COMBINE-2010, October 7, 2010. Supplementary materials: http://www.biouml.org/combine-2010.shtml. Rendering, editing. Java client (BioUML workbench).

E N D
Encoding and exchanging graphical representation: architecture and formats Fedor Kolpakov Institute of Systems BiologyNovosibirsk, Russia COMBINE-2010, October 7, 2010
Supplementary materials: http://www.biouml.org/combine-2010.shtml
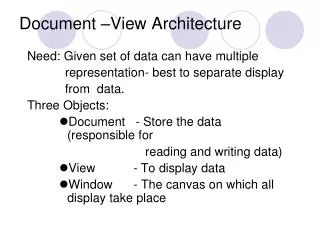
Rendering, editing Java client(BioUML workbench) Web browser using HTML5 <canvas> element (BioUML web edition) Architecture JSON Graphical primitives: (line, box, text, etc.) similar with SBML layout extension Graphic notation editor Diagram view builder Formal definition:properties, nodes, edgesJavaScript functions: - build node/edge view - semantic controller Merged graph model Model Graph model Graph model Data SBML … BioPAX SBGN info Graphic notation XML formats
http://79.125.109.165/bioumlweb/#de=databases/Biopath/Diagrams/DGR0240rhttp://79.125.109.165/bioumlweb/#de=databases/Biopath/Diagrams/DGR0240r Rendering of large diagram by web browser(please try: move, zoom, edit)
Example: system from two chemical reactions - k1[A] - k2[B] k1[A] K2[B] A B C R1 R2 100 0 0 k1 - reaction rate for R1 k2 – reaction rate for R2 Corresponding mathematical model:
Meta-model: example of formal description of system from two chemical reactions - k1[A] - k2[B] k1[A] k2[B] A B C R1 R2 100 0 0 Description of systemcomponents in thedatabase:predefined standard types + any attributes ID R1 ID B ID R2 ID C ID A A - >B CC .. B - >C CC .. CC .. ... ... ... ... ... // // // // // System structure is described as a compartmtalised attributed graph R1 R2 C A B Mathematical model 0 - k2[B] k2[B] k1[A] 100 - k1[A] 0 of the system
Graphic notation editormain concepts • graphic notation is defined formally as XML document • graphic notation editor provides user friendly interface for XML document editing • SBGN graphic notation (prototype) is implemented • BioUML workbench allows to create and edit diagrams using graphic notation defined as XML document
Graphic notation versus graph layout • allows edit diagram • allows to create new diagram • allows formally define SBGN and use it in diagrams from different sources (SBML, BioPAX, TRANSPATH, Reactome, etc.) • allows to reuse graphic notation by many tools
Graphic notation – main components • properties – formal definition of properties that can be used as properties of nodes and edges (for example, title, multimer, etc.). Definition of property includes: • name, type • short description • controlled vocabulary (optional) • node types – definition of node includes: • name • icon • properties • view function (JavaScript) • short description • edge types – definition of edge includes: • name • icon • properties • view function (JavaScript) • short description • semantic controller – defines rules for semantic control of diagram integrity. For this purpose it defines following functions: • canAccept (JavaScript) • isResizable (JavaScript) • move (JavaScript)
<!ELEMENT graphicNotation (properties, nodes, edges?, viewOptions?, semanticController?, viewBuilder?)> <!-- <!ATTLIST graphicNotation version CDATA "0.7.9" appVersion CDATA "0.7.9" >
<!ELEMENT properties (property*)> <!ELEMENT property (tags?)> <!ATTLIST property name CDATA #REQUIRED type CDATA #REQUIRED short-description CDATA #IMPLIED value CDATA > <!ELEMENT tags (tag+)> <!ELEMENT tag> <!ATTLIST tag name CDATA #REQUIRED value CDATA #IMPLIED > <!-- Possible property types: --> <!-- - simple types: boolean, int, double, String --> <!-- - special types: pen, brush, size --> <!-- - array --> <!-- - composite -->
<!-- Nodes and edges --> <!ELEMENT propertyRef> <!ATTLIST propertyRef name CDATA #REQUIRED value CDATA > <!ELEMENT nodes (node+)> <!ELEMENT node (propertyRef*)> <!ATTLIST node type CDATA #REQUIRED icon CDATA #IMPLIED isCompartment CDATA #IMPLIED > <!ELEMENT edges (edge+)> <!ELEMENT edge (propertyRef*)> <!ATTLIST edge type CDATA #REQUIRED icon CDATA #IMPLIED >
<!-- ViewOptions, ViewBuilder --> <!ELEMENT viewOptions (property*)> <!ATTLIST viewOptions > <!ELEMENT viewBuilder (nodeView*), (edgeView*) > <!ATTLIST viewBuilder prototype CDATA #REQUIRED > <-- JavaScript code to create node/edge view --> <!ELEMENT nodeView> <!ATTLIST nodeview type CDATA #REQUIRED > <!ELEMENT edgeView> <!ATTLIST edgeView type CDATA #REQUIRED >
<!-- Semantic controller --> <!ELEMENT semanticController (canAccept?, isResizable?, move?)> <!ATTLIST semanticController prototype CDATA #REQUIRED > <-- JavaScript code for semantic controller --> <!ELEMENT canAccept> <!ELEMENT isResizable> <!ELEMENT move> <!-- Icons --> <!ELEMENT icons (icon*)> <!ELEMENT icon> <!ATTLIST icon name CDATA #REQUIRED >
Why JavaScript? • can be integrated and executed by programs on different languages, including: • Java – includes JavaScript support from version 1.6, Rhino JavaScript library • C++ – SpiderMonkey library • can be executed by browserHTML 5 standard defines <canvas> element for drawing. Now diagrams drawing and editing can be done by web browser.(see BioUML web edition as en example)
Access to graph model from JavaScript functions in graphic notation var multimer = node.getValue( "sbgn:multimer", // property name 0); // default value var entityType = node.getValue( "sbgn:entityType", // property name "unspecified"); // default value
List of specific properties that are used by graphic notation Properties editor
For each node type user can define: • name • properties • icon • view function (JavaScript)
“Examples” node contains a set of diagrams that demonstrates usage of graphic notation.
When user selects some element on the diagram he can edit: • object properties • JavaScript that builds a view for selected diagram element
“Semantic controller” node contains list of JavaScript functions that provide semantic constraints and semantic integrity of the diagram.
SBGN information: main principles • initial ideas: http://sbgn.org/LibSbgnMeeting090409 • SBGN info: - compartmentalized attributed graph (SBGN graph) - references to biological object (SBML, BioPAX, TRANSPATH, etc. elements) - biological statements (complex structure, modifications, etc.) - graph layout - style for rendering- styles info (predefined pens, brus, colors, etc.) • SBGN info + graphic notationcontains all necessary information to generate and edit diagram • SBGN info is stored in XML format- as XML fragment (inserted into SBML <annotation> element)- as XML document (for example, for BioPAX and TRANSPATH) • Information from SBML, BioPAX, Transpath, and other sources is represented as compartmentalized attributed graph and can be merged with SBGN graph using graph element identifiers.
<!ELEMENT sbgn (nodes, edges?, styles?)> <!ELEMENT nodes (node)*> <!ELEMENT node (label, nodeLayout, nodeRendering?)> <!ATTLIST node id CDATA #REQUIRED type CDATA #REQUIRED parent CDATA #REQUIRED ref CDATA clone CDATA > <!ELEMENT label (html?)> <!ATTLIST label value CDATA style CDATA colorFont CDATA >
<!ELEMENT nodeLayout> <!ATTLIST nodeLayout x CDATA #REQUIRED y CDATA #REQUIRED width CDATA #REQUIRED height CDATA > <!ELEMENT nodeRendering> <!ATTLIST nodeRendering style CDATA #REQUIRED pen CDATA brush CDATA >
<!ELEMENT edges (edge)*> <!ELEMENT edge (path?, edgeRendering?)> <!ATTLIST edge id CDATA #REQUIRED type CDATA #REQUIRED from CDATA #REQUIRED to CDATA #REQUIRED ref CDATA >
<!– path concept is based on Javajava.awt.geom.GeneralPath concept.Path represents a geometric path constructed from straight lines, and quadratic and cubic (B?zier) curves. --> <!ENTITY % segmentType "(moveTo|lineTo|quadTo|cubicTo|close)"> <!ELEMENT path (segment)+> <!ELEMENT segment> <!ATTLIST segment type segmentType #REQUIRED x0 CDATA y0 CDATA x1 CDATA y1 CDATA x2 CDATA y2 CDATA >
<!ELEMENT styles (style)*> <!ELEMENT style (pen?, brush?, font?)> <!ATTLIST style id CDATA #REQUIRED comment CDATA #REQUIRED > <!ELEMENT pen> <!ATTLIST pen id CDATA #REQUIRED width CDATA #REQUIRED color CDATA #REQUIRED stroke CDATA > <!ELEMENT brush> <!ATTLIST brush id CDATA #REQUIRED color CDATA #REQUIRED ... >
<!ELEMENT font> <!ATTLIST font id CDATA #REQUIRED style CDATA #REQUIRED size CDATA #REQUIRED bold CDATA italic CDATA underline CDATA color CDATA >
Example: XML fragment for SBML diagram in SBGN notation <annotation> <sbgn xmlns:biouml="http://www.biouml.org/ns" notation="./graphicnotations/sbgn_simulation.xml"> <nodes> <node id="CMP0219" parent="" ref="CMP0219“ type="compartment"> <nodeLayout height="450" width="810" x="65" y="40"/> </node> <node id="PRT003759" parent="CMP0219.CMP0003“ ref="CMP0219_CMP0003_PRT003759" type="macromolecule"> <nodeLayout height="40" width="94" x="96" y="195"/> </node> <node id="PP" parent="CMP0219.CMP0003.PRT003759" ref="" type="variable"> <nodeLayout x="102" y="185"/> </node>
<edges> <edge id="RCT005640: PRT003081 as product“ ref="RCT005640: PRT003081 as product" from="CMP0219.CMP0003.RCT005640" to="CMP0219.CMP0003.PRT003081" type="production"> <path> <segment segmentType="moveTo" x0="798" y0="224" /> <segment segmentType="quadric" x0="822" y0="163" /> <segment segmentType="lineTo" x0="763" y0="134" /> </path> </edge> ...
Example: TRANSPATH pathway in SBGN notation (automatically generated diagram)
Rendering, editing Java client(BioUML workbench) Web browser using HTML5 <canvas> element (BioUML web edition) Architecture JSON Graphical primitives: (line, box, text, etc.) similar with SBML layout extension Graphic notation editor Diagram view builder Formal definition:properties, nodes, edgesJavaScript functions: - build node/edge view - semantic controller Merged graph model Model Graph model Graph model Data SBML … BioPAX SBGN info Graphic notation XML formats
Acknowledgements Part of this work was partially supported by following grants: • European Committee grant “Net2Drug” and “LipidomicNet” • Siberian Branch of Russian Academy of Sciences (interdisciplinary projects № 46, 17, 91) BioUML team (2010): • Nikita Tolstyh • Tagir Valeev • Alexey Shadrin • Ilya Kiselev • Elena Kutumova • Anna Ryabova • Boris Semisalov