Download
1 / 16
160 likes | 184 Views
Explore the concepts of economic growth, business cycles, unemployment, full employment, Okun’s Law, inflation, and more. Understand the impact of these factors on the economy and society.

E N D
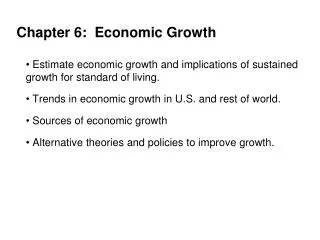
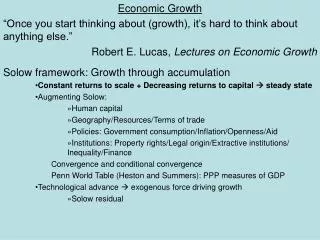
Ch 7. Intro to Economic Growth & Instability Why do we want economic growth??
A. Economic Growth – in either real GDP or Real GDP per capita over time. In 2001, China’s GDP was 1,1131 Billion compared to Denmark’s 166 Billion. However, Denmark’s GDP per capita was $31,090 compared to China’s $890. -- The time period is calculated as a quarter (3-months) or year. -- Real GDP is GDP adjusted for inflation. -- Real GDP per capita = dividing real GDP by the size of the population.
1. “Rule of 70.” 2. Sources of growth. Rule of 70 Approx # of Years required = 70 to double the annual % rate Real GDP of growth A 3% annual rate of growth will double Real GDP in about 23 (= 70 divided by .03) -- Rule of 70 tells us the number of years it will take for some measure to double, given its annual percentage increase, by dividing that % increase into 70. -- Sources of growth: increasing inputs of resources or increasing productivity.
B. Business cycle - & levels of economic activity. 1. Peak 2. Recession 3. Trough 4. Recovery The 4 Seasons = Business cycle I U Summer (Boom) Spring (Recovery) Fall (Recession) Winter (Depression) -- Trough is where a recession or depression bottoms out. -- Causes in fluctuations: changes in production, supply, demand, spending, policies.
The Business Cycle Phases of the Business Cycle Peak Peak Trend Expansion Peak Growth Level of Real Output Recession Trough Expansion Recession Trough Time Cyclical Impact: Durables and Nondurables
Unequal Burden: -- Occupation -- Age -- Race & ethnicity -- Gender (similar) -- Education C. Unemployment 1. Frictional 2. Structural 3. Cyclical Does not include those under 16 years old and/or institutionalized. -- Frictional – between jobs. -- Structural – skills not needed or possess no skills. -- Cyclical – caused by a decline on spending (recession).
Unemployment Labor Force, Employment, and Unemployment, 2005 Under 16 And/or Institutionalized (70.5 Million) Not in Labor Force (76.8 Million) Total Population (296.6 Million) Employed (141.7 Million) Labor Force (149.3 Million) 7,591,000 149,320,000 X 100 = 5.1% unemployment rate Unemployed (7.6 Million)
D. Full employment: # of job seekers = # of job vacancies. No cyclical unemployment -- Full employment, or the natural rate of employment (NRU) fluctuates over time due to fewer workers after the baby boomers, growth of temp workers, and doubling of the prison population since 1985.
E. Okun’s Law – for every 1% point the unemployment rate exceeds the natural rate (full employment), a negative GDP gap of 2% point occurs. -- Macroeconomist Arthur Okun discovered the relationship between the unemployment rate and the GDP gap.
Okun’s Law • Actual and potential GDP and the unemployment. • (a) Difference between actual & potential GDP is the GDP gap. A negative gap measures the output the economy sacrifices when actual GDP falls short of potential GDP. A positive GDP gap shows the opposite. • (b) A high unemployment rate means a large GDP gap (negative), and a low unemployment rate means a small or even positive GDP gap.
Value of $ declines F. Inflation – in level of prices. 1. Consumer Price Index (CPI) – main measure of inflation. Rate of inflation = 179.9 – 177.1 x 100 = 1.6% 177.1 i = Δ in CPI X 100 current CPI The CPI was 179.9 in 2002, up from 177.1 in 2001. Rule of 70: A 1.6% annual rate of inflation will double the price level in about 43 years. -- When inflation occurs, each dollar of income will buy fewer goods & services than before (reduces ‘purchasing power’). -- CPI is compiled by the Bureau of Labor Statistics (BLS). -- The BLS arbitrarily sets the CPA equal to 100 for 1982-84 (start point). -- The gov’t uses the index for monthly reports on inflation rates.
-- CPI reports the price of a ‘market basket’ of 300 consumer goods/services. -- The BLS updates the composition of the market basket every 2 years. -- Will take 6 years to double the inflation rate at 12%.
Two Types of Inflation Demand-Pull Inflation – Caused by an excess of total spending beyond the economy’s ability to produce. When inflation is rapid and sustained, it may be due to an overissuance of money by the central bank (the U.S. Federal Reserve). Cost-Push Inflation – Results from an increase in resource costs.
Who’s hurt / helped by Inflation? HURT • Fixed-income receivers • Savers (less purchasing power) • Creditors (lenders) HELPED • Flexible-income receivers (COLAs) • Debtors (home loans)
G. Hyperinflation H. Deflation. I. Nominal income (money) vs. real income. -- Nominal Income: # of dollars in wages, rent, income, or profits. -- Real Income: amount of goods/services that nominal income can buy. The German Weimar Republic printed so much money to pay Its bills after WWI that prices rose 1.3 trillion times. A German woman in 1923 burning Deutsche Marks because it was cheaper than buying wood to burn.