Download
1 / 9
90 likes | 233 Views
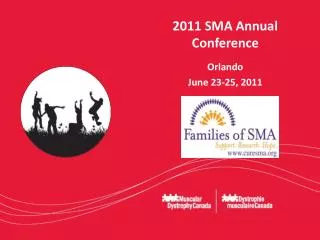
2011 SMA Energy Bowl Final Results and Awards. Joe Abernathy President, SMA VP of Stadium Operations Busch Stadium. February 8, 2012. What is the Energy Bowl?. An energy efficiency competition in which SMA member venues competed to reduce their 2011 energy consumption.

E N D
2011 SMA Energy Bowl Final Results and Awards Joe Abernathy President, SMA VP of Stadium Operations Busch Stadium February 8, 2012
What is the Energy Bowl? • An energy efficiency competition in which SMA member venues competed to reduce their 2011 energy consumption. • Participants tracked 2011 energy use and compared it to 2010 energy consumption using EPA ENERGY STAR’s free measurement and tracking tool, Portfolio Manager. energystar.gov/portfoliomanager • Achievement is based on percent reduction in energy use intensity (kBtu/sf).
Participating Venues • Rangers Ballpark in Arlington • Cleveland Browns Stadium • CenturyLink Field • Ralph Wilson Stadium • Target Field • Georgia Dome • PGE Park • MetLife Stadium • M&T Bank Stadium • Progressive Field • Miller Park • Busch Stadium • Chase Field • Safeco Field • PNC Park • Turner Field • Tropicana Field • Great American Ball Park • Nationals Park • Sports Authority Field at Mile High Stadium
2011 SMA Energy Bowl Champions Honorable Mention (percent reduction ≥ 10%)Nationals Park (-14.6%) Target Field (-10.9%) Overall Champion: Tropicana Field (-16.6%) NFL Champion: MetLife Stadium(-13.3%) MLB Champion: Tropicana Field (-16.6%)
Aggregate Results • Participants collectively reduced energy consumption by 50 million kBtu, equivalent to the: • Electricity needed to light almost 7,500 homes annually • Greenhouse gas emissions generated from nearly 2,000 cars per year • Generated cost savings over $1 million • Ranged from $40K - $588K
Best Practices • Tropicana Field • Enhanced management and operational controls with their Building Automation System • Computer now automatically controls all fans based on temperature and humidity • System previously ran at either 100% or was off. Now it can run at 50% • MetLife Stadium • Focused on improving operational controls and systems to maximize energy efficiency, such as controls for: • Lighting (stadium and parking lots) • Condenser water system • Air handling units
Best Practices • Target Field • Maximized the Building Automation System • Replaced lighting systems with LED or fluorescents • Re-commissioned HVAC systems • Implemented a “winterization” mode to shut off unnecessary equipment during the off-season. • Nationals Park • Close monitoring via energy management system during non-game days and in unoccupied spaces • Regular analysis of utility bills