Download
1 / 29
290 likes | 390 Views
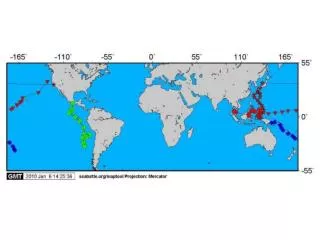
27957, 27960: nesting grounds in Jamursba-Medi, Papua, Indonesia 27957: Foraging grounds: Oregon, Washington, Hawaii?, temperate eastern pacific. 27960: Foraging grounds: Malaysia, Philippines

E N D
27957, 27960: nesting grounds in Jamursba-Medi, Papua, Indonesia 27957: Foraging grounds: Oregon, Washington, Hawaii?, temperate eastern pacific. 27960: Foraging grounds: Malaysia, Philippines Countries: USA, Indonesia, Palau?, PNG, FS Micronesia, Marshall Islands, Philippines, Malaysia, Vietnam?, Thailand
27960 27957 GIS! RFMOs: APFIC, FFA, WCPFC, SPC, IATC, SPRFOM, SEAFDEC, CCBST More data: more tracking data, fisheries data on interactions 5394: PNG, Solomon Islands, Vanuatu, Fiji, NZ, New Caledonia
Overlapping EEZ’s • Agreement (STP, Nigeria) • Dispute (South China Sea)
SIO 296 Concept Lecture II Phaedra Doukakis, Ph.D. January 15, 2010
Managed species don’t exist in isolation • Highly Migratory Species are a shared resource existing within and outside of our/an EEZ and can require trans-boundary management. • Discussed tools to inform and perform management: tagging and tracking to understand spatial structure; RFMO’s to manage trans-boundary stock.
Building upon this • More on how understanding spatial structure is necessary and how it’s detected. • Continuing to move toward holistic management: ecosystem based fisheries management (EBFM).
Traditional Approach to Fisheries Stock Assessment Model Balance reproduction and growth with mortality to sustain population biomass
Density Dependant Mortality Mortality and reproduction aren’t independent: competition and predation, abiotic factors; density dependant.
Sustainable Yield • What is the largest fishing mortality rate that can be offset by increased population growth?
Population reaches maximum due to carrying capacity; Growth rate peaks and declines due to density dependence The MSY in biomass occurs at a level of fishing mortality that places the population at this intermediate size.
Reference Points • Better to think of MSY as a percentage of the population rather than a fixed figure because populations fluctuate. • Think of it as a limit (limit reference point) rather than target (target reference point) • Reference points begin as conceptual criteria which capture in broad terms the management objective for the fishery which are then turned into technical criteria, e.g. objective is maximize yield = MSY.
Overly Simplistic • Parameters such as abundance and population growth are hard to estimate. • A species subject to a fishery interacts with other ecosystem components (prey, predators, abiotic factors) that influence model parameters; it doesn’t exist in isolation…
Ecosystem Based Fishery Management • Ill-defined concept; many attempts in the last 10 years. • Managing fishery within an ecosystem context, taking into account ecological interactions, sensitive species and habitats, environmental forcing and effects, social and economic structures and impacts. • Requires new objectives and tools.
Ecosystem Based Management Pikitch et al. 2004 Science • reversing the order of management priorities to start with the ecosystem rather than the target species. • i) avoid degradation of ecosystems; • ii) minimize the risk of irreversible change to natural assemblages of species and ecosystem processes; • (iii) obtain and maintain long-term socioeconomic benefits without compromising the ecosystem; and • (iv) generate knowledge of ecosystem processes sufficient to understand the likely consequences of human actions.
Irreversible Change? • Harvest of the Namibian sardine and other small pelagics in the Northern Benguela current ecosystem: shift in the species composition of the system, with sardine and anchovy replaced by the pelagic goby as the principle forage species. • Additive effects of fishing and environmental anomalies: small pelagics did not recover after fishing curtailed,: sardines at only 10% of their former abundance. • Declines of Namibia’s seabirds (Crawford 2007; Crawford et al. 2007). • Intensive fishing altered the trophic control mechanism so that environmental factors exert a greater influence (Watermeyer et al. 2008)? • Other examples of ecosystem regime shifts? Cod? Top predators? Regime shift to another state.
Ecosystem Based Management Pikitch et al. 2004 Science • Develop community and system indicators of “health”. • Precautionary, adaptive management (feedback loops).
Crowder et al. 2008 • Manage the direct and indirect effects of commercial fisheries… include impacts of bycatch, recreational fisheries, artisanal fisheries, and environmental change that can be large but unanticipated . • Synergistic effects of fishing, environmental variation, and climate change increasingly threaten marine ecosystems and complicate management.
Francis et al. 2007 Fisheries: 10 commandments of EBFM • Holistic, risk-averse, and adaptive. • Maintain old-growth age structure in fish populations. • Characterize and maintain the natural spatial structure of fish stocks. • Characterize and maintain viable fish habitats. • Characterize and maintain ecosystem resilience. • Identify and maintain critical food web connections. • Account for ecosystem change through time. • Account for evolutionary change caused by fishing. • Implement an approach that is integrated, interdisciplinary, and inclusive.
Australia • Considers the impact that fishing has on all aspects of the marine ecosystem, not just the target species. • Ecological risk assessment to evaluate the ecological effects of fishing • Managing by-catch • Avoiding Protected Species
North Pacific Fishery Management Council • Groundfish: • Setting TACs (and reference points) low and precautionary. • Minimizing by-catch. • Establishing MPA’s for habitat preservation. • Avoiding Protected species. • Currently defining for the Aleutian Islands
Marine Stewardship Council • The fishery does not cause serious or irreversible harm to the key elements of ecosystem structure and function. • There is adequate knowledge of the impacts of the fishery on the ecosystem.
Antarctic and CCAMLR • Set fishing limits on krill at about 9% of existing biomass (4 million tons). • Safeguards percent of biomass for predators. • Allocate quota among small scale management units to protect spatially confined predators; data requirements substantial.
Magnuson Stevens Act Reauthorization • Mandated ecosystem management report. • Report indicated more data are needed on fished species and ecosystems; modelers need these data. • http://spo.nwr.noaa.gov/tm/TM96Web.pdf • Still being defined in the USA.
Identify key management objectives and constraints, identify appropriate indicators and management thresholds, determines the risk that indicators will fall below management targets, and combines risk assessments of individual indicators into a determination of overall ecosystem status. The potential of different management strategies to alter ecosystem status is evaluated, and then management actions are implemented and their effectiveness monitored. The cycle is repeated in an adaptive manner. Levin PS, Fogarty MJ, Murawski SA, Fluharty D (2009) Integrated Ecosystem Assessments: Developing the Scientific Basis for Ecosystem-Based Management of the Ocean. PLoS Biol 7(1): e1000014. doi:10.1371/journal.pbio.1000014
Research & Tools • More on the ecosystem effects of fishing –metrics of ecosystem health. • Spatially explicit multi-species assessments. • Understanding and accounting for variability. • Tools we have now: • single stock assessment but different objectives • conservative TAC’s and reference points (Atlantic mackerel SSBMSY twice as high when predation is considered (Moustahfid et al. 2009) • spatial limits • adaptive management with ecosystem monitoring.
Demonstrating the complexity… • Lecture on management of HMS: • Getting the data needed for assembling an ecosystem plan: • Stock structure • Predatory prey relationships (and how they may shift due to climate) • Abundance estimates • Forage species: managing fisheries in the context of environmental forcing.